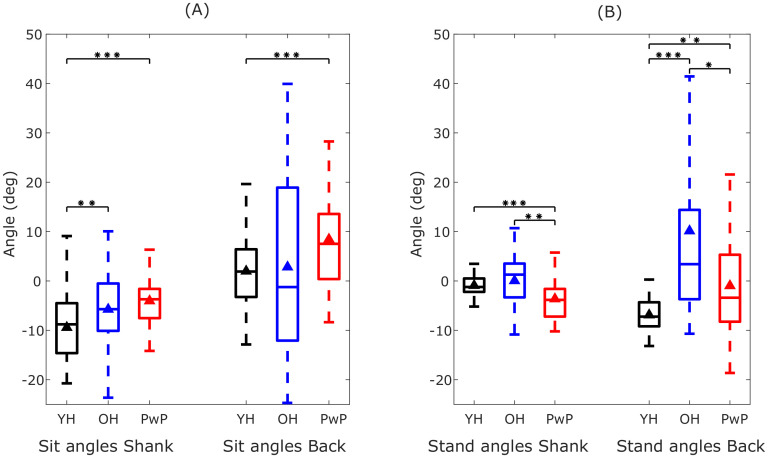
Fig 10. Variability in the posture during sitting and standing in the shank and back in younger healthy (YH) adults, older healthy (OH) adults and people with Parkinson’s (PwP).
(A) The average angles of the shank and back in YH, OH and PwP participants during sitting. The black triangle shows the mean angle. (B) The average angles of the shank and back in YH, OH and PwP participants during standing. Statistically significant differences (Mann-Whitney U test with Bonferroni correction for multiple tests) in the angles of the shank and back among the three groups during sitting and standing are shown by the stars indicting the p-values (one star indicates p < 0.5, two stars indicate p < 0.01 and three stars indicate p < 0.001).

