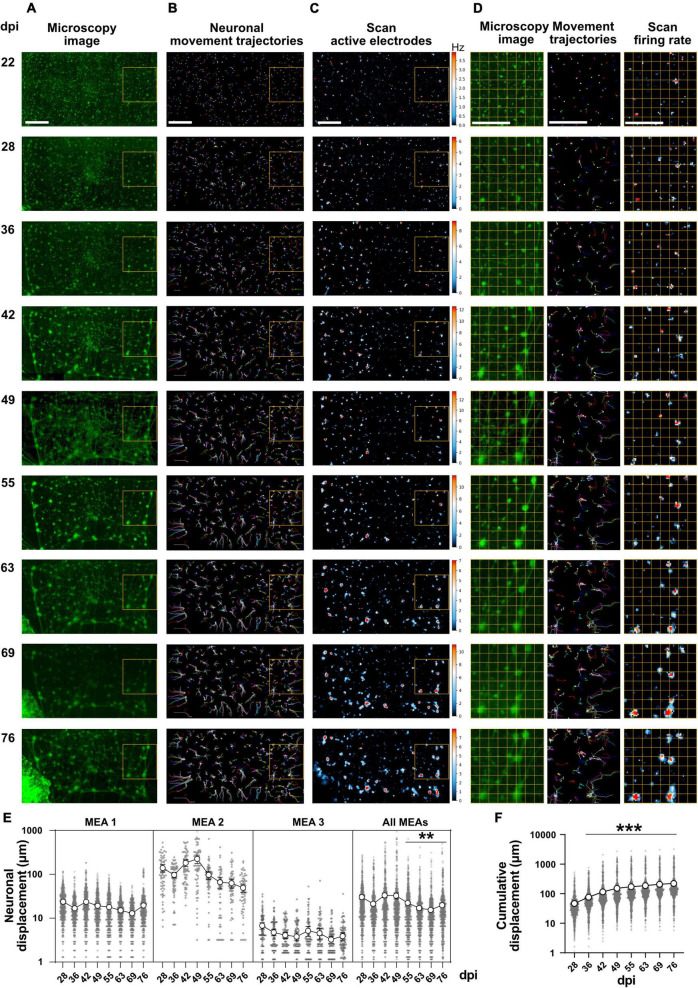
FIGURE 2.
Network morphology and activity images at different days post induction. (A) Fluorescence microscopy images from whole networks were prepared by stitching 40 images at each time point. Magnified view of network morphology on 22, 28, and 63 dpi are illustrated in Supplementary Figure 1. Scale bar is 500 μm. (B) Neuronal movement trajectories were extracted from morphology image sequences at different weeks. A magnified view of the trajectories is shown in Supplementary Figure 2. Scale bar is 500 μm. (C) Network activity image based on firing rates. Each day, a full Activity Scan was performed that included 30 s recording from each electrode. Electrodes that showed activity are represented by blue color. The color code indicates firing rates from no activity as black, to medium activity as blue and maximum firing rates as red (firing rates have not been normalized across different days and color coding represents different scales of the activity between frames). Scale bar is 500 μm. (D) Magnified view of a network region (left column), neuronal movement trajectory (middle) and activity image of the same region (right column) at different days post induction (marked by yellow rectangles in A–C). Each image in (D) represents a sensor area including approximately 56 × 56 electrodes and each small square with yellow border represents a sensor area of approximately 7 × 7 electrodes. Scale bar is 500 μm. (E) Neuronal displacement at different days during network development in 3 individual HD-MEAs with 721, 68, and 115 neurons tracked in each MEA, respectively, and all MEAs together (N = 3 MEAs). Each circle represents the distance that a neuron shifted from the previous time point (dpi). Average displacement (n = 904 neurons) is represented as big circles with lines (**p < 0.01 vs. 28 dpi. F). Cumulative displacement of neuronal soma position between 22 and 76 dpi for 904 neurons of 3 HD-MEAs (***p < 0.001 vs. 28 dpi). Data have been collected from 904 neurons in 3 HD-MEAs at 8 time points between 28 and 76 dpi and were compared using Kruskal-Wallis test followed by Dunn’s multiple comparison test. Percentage of neurons showed specific measure of displacement have been represented in Supplementary Figure 4.

