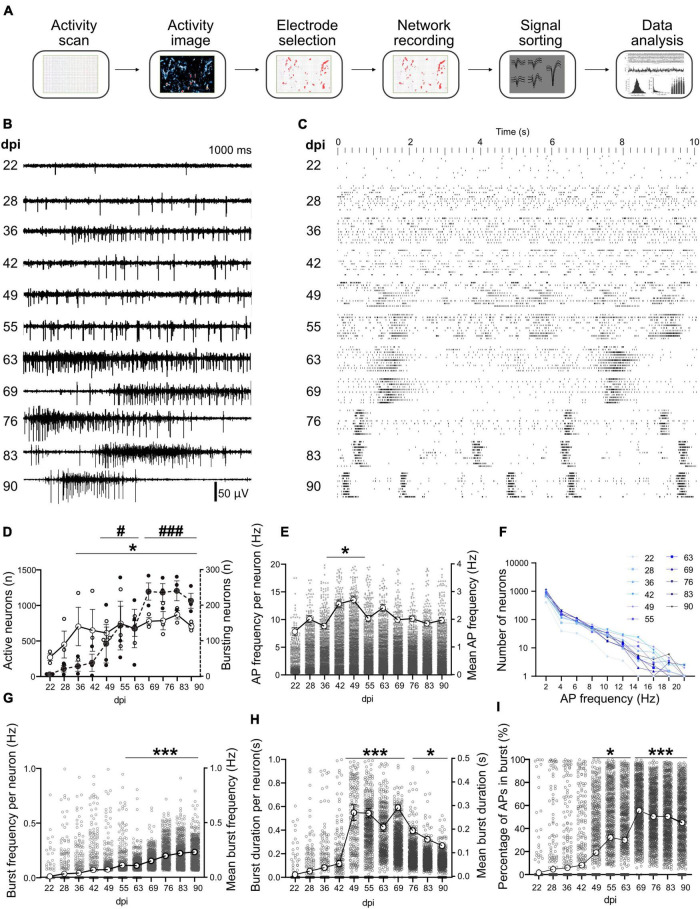
FIGURE 3.
Long-term activity profile of developing hiPSCs-derived networks. (A) Pipeline of data acquisition and analysis. After a full activity scan of the whole array and extracting the activity image, the most active electrodes were selected and used for simultaneous recording for network analysis. Recorded data was spike sorted to identify neurons, then timestamps of neuronal activity were extracted and used for data analysis. (B) Representative signal trace in a selected electrode at different days post induction (dpi). (C) Ten second raster plot profile of detected APs in 10 neurons (aligned in rows) on different dpi. (D) Number of active neurons and number of neurons involved in network burst activity. Neurons that showed more than 0.1 Hz AP frequency were considered as active neurons. (E) Average AP frequency was calculated by dividing the total number of APs to the overall recording period at each dpi. (F) Number of neurons firing in different frequency domains at different days (color-coded). (G–I) Burst frequency, burst duration and percentage of APs that appear inside burst events at different days. Data of N = 3 MEAs with n > 1,065 neurons per day were included in the analysis (D–I) and compared between days based on Kruskal-Wallis test followed by Dunn’s multiple comparison test. *p < 0.05, and ***p < 0.001 vs. 22 and 28 dpi. For the number of neurons that contributed to burst activity #p < 0.05 and ###p < 0.001 vs. 22, 28, and 36 dpi. Each point represents the corresponding activity feature in one neuron.

