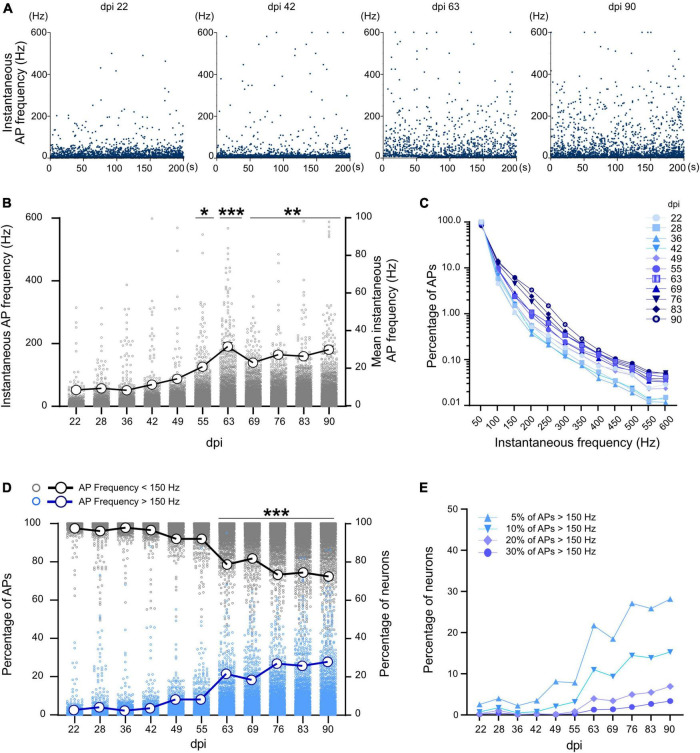
FIGURE 4.
Instantaneous firing frequency in developing neuronal networks. (A) Instantaneous frequency of individual APs (spiking events) in a selected neuron at different time points. Each data point represents the instantaneous frequency of specific pair of APs during a 200 s recording period. (B) Average instantaneous frequency at different time points. Each data point represents the average instantaneous frequency of a neuron at particular dpi. Mean of the average frequencies in all neurons represented by large circles and thick line. (C) Distribution of the percentage of spiking events over the instantaneous frequency domains at different days (n > 400,000 events per dpi, N = 3 MEAs). (D) Percentage of APs with more than 150 Hz (blue) and less than 150 Hz (gray) in all neurons (n > 1,064 neurons). The thick blue line represents percentage of neurons with at least 5% of high frequency (>150 Hz) spiking events and the thick black line represents the percentage of the neurons with at least 95% low frequency spiking events (<150 Hz). (E) Percentage of neurons which have 5, 10, 20, or 30% of their spiking events in the high frequency domain (<150 Hz). Data between days were compared based on Kruskal-Wallis test followed by Dunn’s multiple comparison test. *p < 0.05, **p < 0.01, and ***p < 0.001 vs. 22, 28, 36, and 42 dpi.

