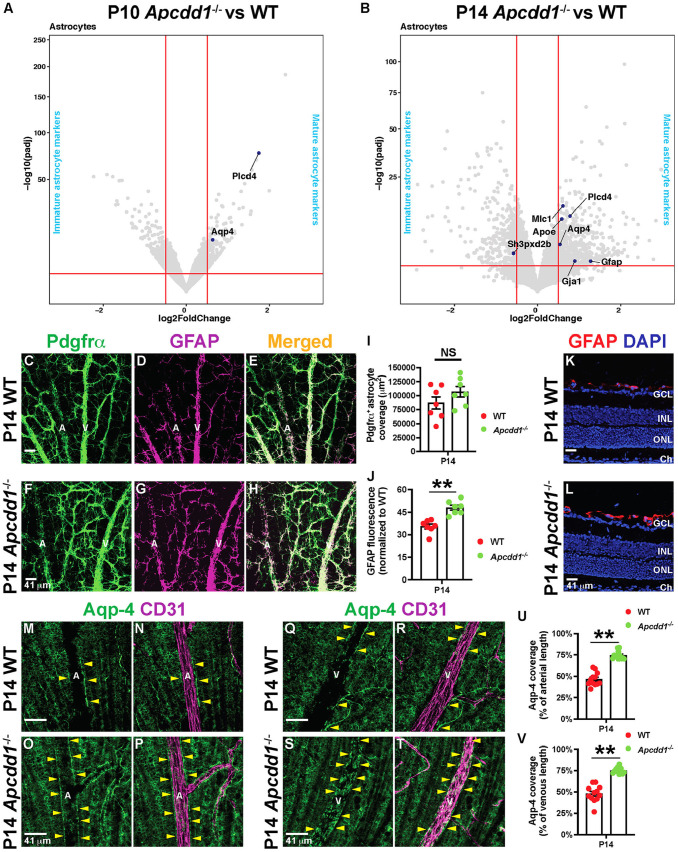
Fig. 6.
Apcdd1−/− retinas show precocious astrocyte maturation and endfeet polarization. (A,B) Volcano plots of statistically significant differentially expressed astrocyte maturation genes (dark blue dots) between Apcdd1−/− and WT retinas at P10 and P14. Conventions as outlined in Fig. 2E-J. (C-H) P14 WT and Apcdd1−/− retinal flat-mounts stained for Pdgfrα (all astrocytes) and GFAP (mature astrocytes). (I,J) Pdgfrα+ astrocyte coverage (I) and GFAP M.F.I. (J) (n=7 mice/genotype). (K,L) P14 WT (K) and Apcdd1−/− (L) retinal sections stained for GFAP and DAPI. (M-T) P14 WT and Apcdd1−/− retinal flat-mounts stained for Aqp4 and CD31 in arteries (M-P) and veins (Q-T). A, artery; V, vein. Yellow arrowheads indicate Aqp4+ astrocyte endfeet around blood vessels. (U,V) Percentage of vascular length surrounded by Aqp4+ astrocyte endfeet (12 arteries or veins from n=6 mice/group). Data are mean±s.e.m., analyzed with two-tailed unpaired Student's t-test: NS, not significant, **P<0.02.

