. 2022 Oct 10;11:e79346. doi: 10.7554/eLife.79346

Figure 3. Evolved mutations rescue fitness and protein glycosylation defects of pACT1-sec53-V238M.

(A) Average fitness effects and standard deviations of reconstructed heterozygous pgm1 mutations. Fitness effects were determined by competitive fitness assays against a fluorescently labeled version of the diploid pACT1-SEC53-WT ancestor. Replicate measurements are plotted as gray circles. Pairs of pgm1 fitness effects with non-statistically significant differences: R64C-D295N, R64C-pgm1Δ, R64C-S120A, D295N-pgm1Δ, G514C-T521K, G514C-S120A, and pgm1Δ-S120A (df = 194, F = 208.1, each p > 0.05, one-way analysis of variance [ANOVA] with Tukey post hoc test). (B) Western blots of invertase (left) and carboxypeptidase Y (right) from ancestral and reconstructed strains. In panels A and B, plus signs (+) indicate wild-type alleles. Genotypes are either homozygous wild-type (+/+), homozygous mutant (mutation/mutation), or heterozygous (mutation/+).

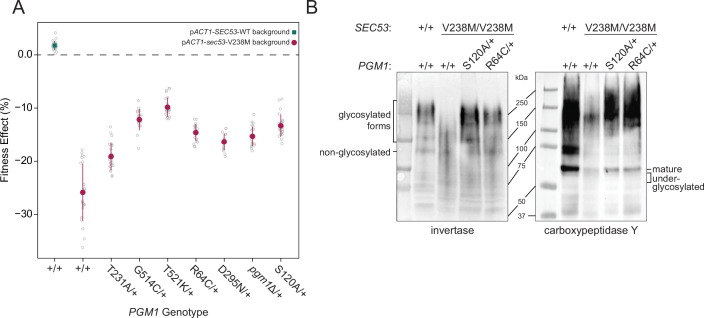
Figure 3—source data 1. Raw images of blots and Ponceau stains.

Figure 3.

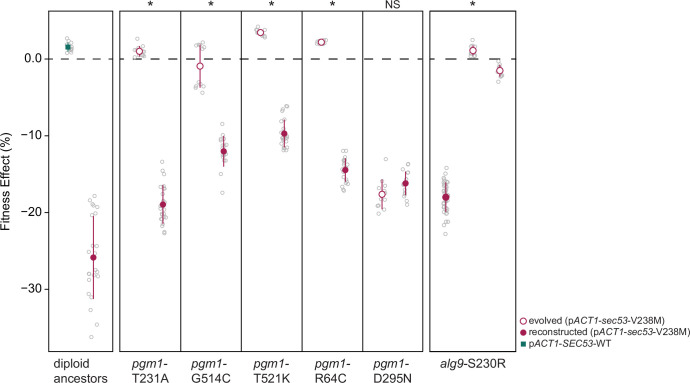
Figure 3—figure supplement 1. Fitness effects of reconstructed mutations and evolved clones containing those same mutations.

Figure 3—figure supplement 1.

Average fitness effects and standard deviations of reconstructed heterozygous pgm1 and alg9 mutations (closed circles) compared to evolved clones containing those mutations plus three to nine additional mutations (open circles). Replicate measurements are plotted as gray circles. Note there are two clones from different populations with an alg9-S230R mutation. Asterisks (*) represent statically significant differences between fitness effects of evolved clones and fitness effects of reconstructed clones (Welch’s modified t-test): pgm1-T231A (p < 0.0001, t = 36.1, df = 28.9); pgm1-G514C (p < 0.0001, t = 11.8, df = 18.4); pgm1-T521K (p < 0.0001, t = 33.8, df = 27.3); pgm1-R64C (p < 0.0001, t = 52.9, df = 24.3); pgm1-D295N (p = 0.05, t = 2.10, df = 19.9); alg9-S230R (left) (p < 0.0001, t = 53.7, df = 49.7); alg9-S230R (right) (p < 0.0001, t = 44.1, df = 46.1).
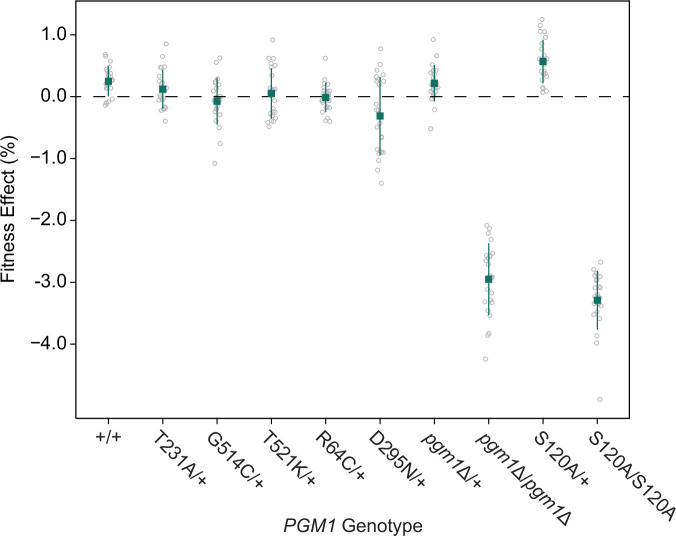
Figure 3—figure supplement 2. Fitness effects of pgm1 mutations in the SEC53-WT background.

Figure 3—figure supplement 2.

Average fitness effects and standard deviations of reconstructed pgm1 mutations in the diploid pACT1-SEC53-WT background. Replicate measurements are plotted as gray circles. Plus signs (+) indicate wild-type alleles.
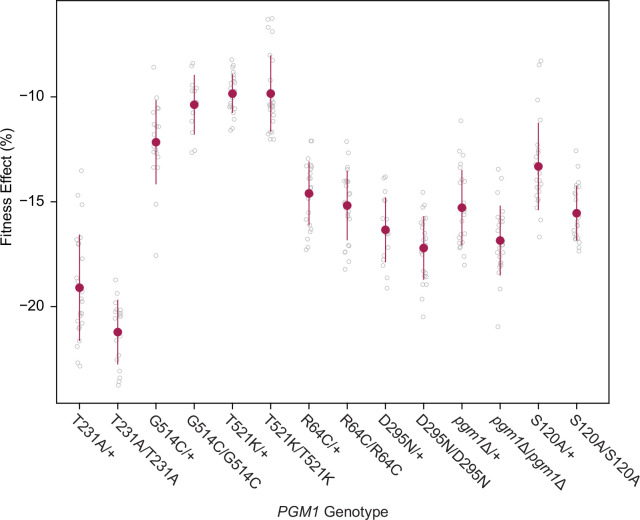
Figure 3—figure supplement 3. Fitness effects of homozygous pgm1 mutations.

Figure 3—figure supplement 3.

Average fitness effects and standard deviations of reconstructed pgm1 mutations in the diploid pACT1-sec53-V238M background as heterozygous (mutation/+) or homozygous (mutation/mutation) alleles. Replicate measurements are plotted as gray circles. Comparison of heterozygous and homozygous allele fitness effects (Welch’s modified t-test): pgm1-T231A (p = 0.002, t = 3.35, df = 38.6); pgm1-G514C (p = 0.008, t = 2.85, df = 27.8); pgm1-T521K (p = 0.996, t = 0.005, df = 34.0); pgm1-R64C (p = 0.219, t = 1.24, df = 45.7); pgm1-T231A (p = 0.077, t = 1.84, df = 36.4); pgm1Δ (p = 0.003, t = 3.12, df = 45.7); pgm1-S120A (p < 0.0001, t = 4.45, df = 38.6).
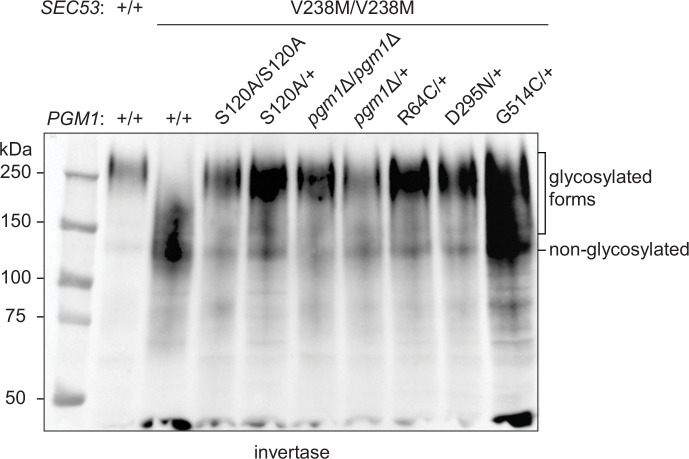
Figure 3—figure supplement 4. Effects of pgm1 mutations on invertase glycosylation in the pACT1-sec53-V238M background.

Figure 3—figure supplement 4.

Western blot of invertase from reconstructed sec53/pgm1 strains.
Figure 3—figure supplement 4—source data 1. Raw images of blots and Ponceau stains.
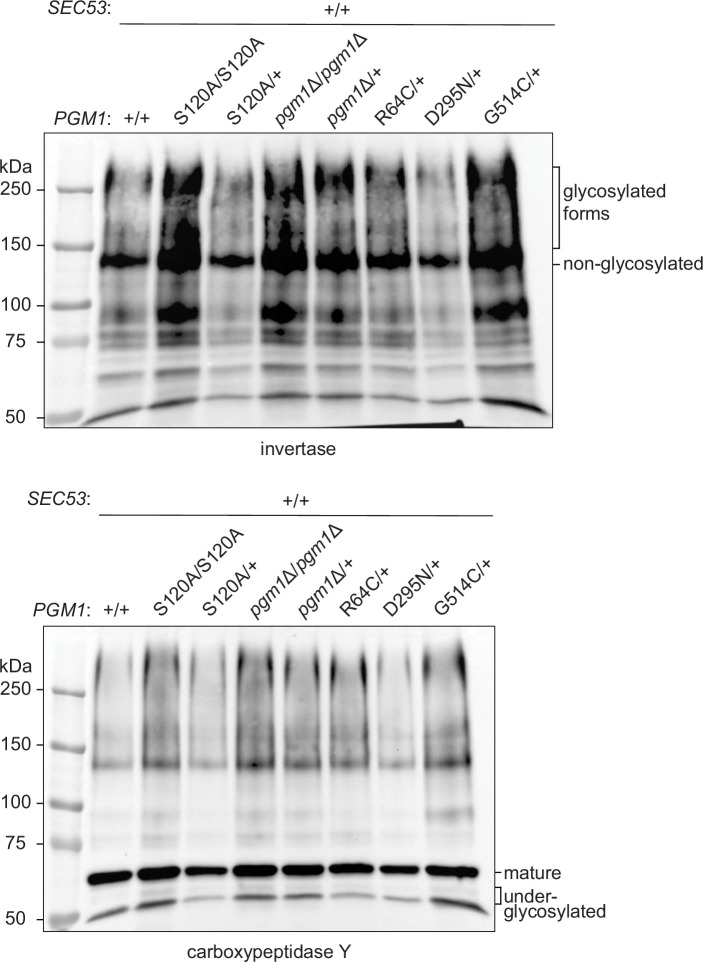
Figure 3—figure supplement 5. Effects of pgm1 mutations on invertase and carboxypeptidase Y (CPY) glycosylation in the pACT1-SEC53-WT background.

Figure 3—figure supplement 5.

Western blots of invertase and CPY from constructed SEC53/pgm1 strains.
Figure 3—figure supplement 5—source data 1. Raw images of blots and Ponceau stains.
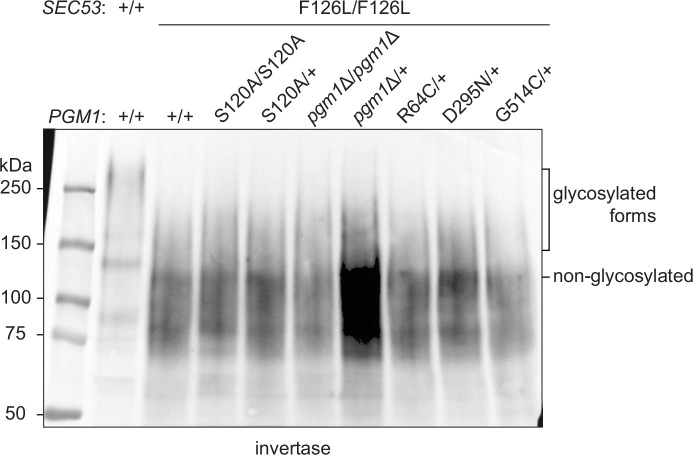
Figure 3—figure supplement 6. Effects of pgm1 mutations on invertase glycosylation in the pACT1-sec53-F126L background.

Figure 3—figure supplement 6.

Western blot of invertase from reconstructed sec53/pgm1 strains.
Figure 3—figure supplement 6—source data 1. Raw images of blots and Ponceau stains.