. 2022 Sep 28;11:e76926. doi: 10.7554/eLife.76926

Figure 1. Meta-analytic connectivity gradients of the LPFC.

The rostrocaudal and dorsoventral gradients explain the greatest amount of variance in meta-analytic connectivity in the LPFC. (A) The principal gradient in both hemispheres echoes a widely proposed rostrocaudal organization in the LPFC. This gradient represents the dominant direction of variations in connectivity patterns. (B) The gradient that explains the second-most variance in meta-analytic connectivity in the LPFC echoes a dorsoventral organization extending from ventrolateral to dorsolateral PFC regions. (C) and (D) The percentage of variance explained by the first 20 diffusion embedding components in the left and right LPFC, respectively.

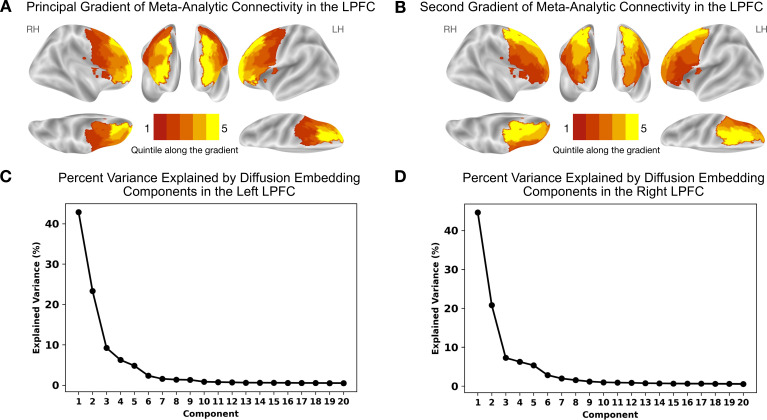
Figure 1.

Figure 1—figure supplement 1. The spatial layout of the principal LPFC gradient across 5000 re-runs of the meta-analysis on random sub-samples of the Neurosynth dataset.

Figure 1—figure supplement 1.

The spatial layout of the principal LPFC gradient across 5000 re-runs of the meta-analysis on random sub-samples of the Neurosynth dataset. We quantify the variation in the spatial layout of the principal LPFC gradient by counting the number of times each region is assigned to every quintile bin in the 5000 re-runs of the meta-analysis (each sub-sample includes 8623 studies, around 60% of the total number of studies). (A) and (B) show the number of times each region has been assigned to each of the five quintile bins in the left and right LPFC, respectively. The majority of LPFC regions in both hemispheres retain the same quintile bin assignment across the 5000 re-runs of the analysis. This result indicates that the spatial layout of the principal gradient is robust to the choice of studies provided that a large of number of studies is included.
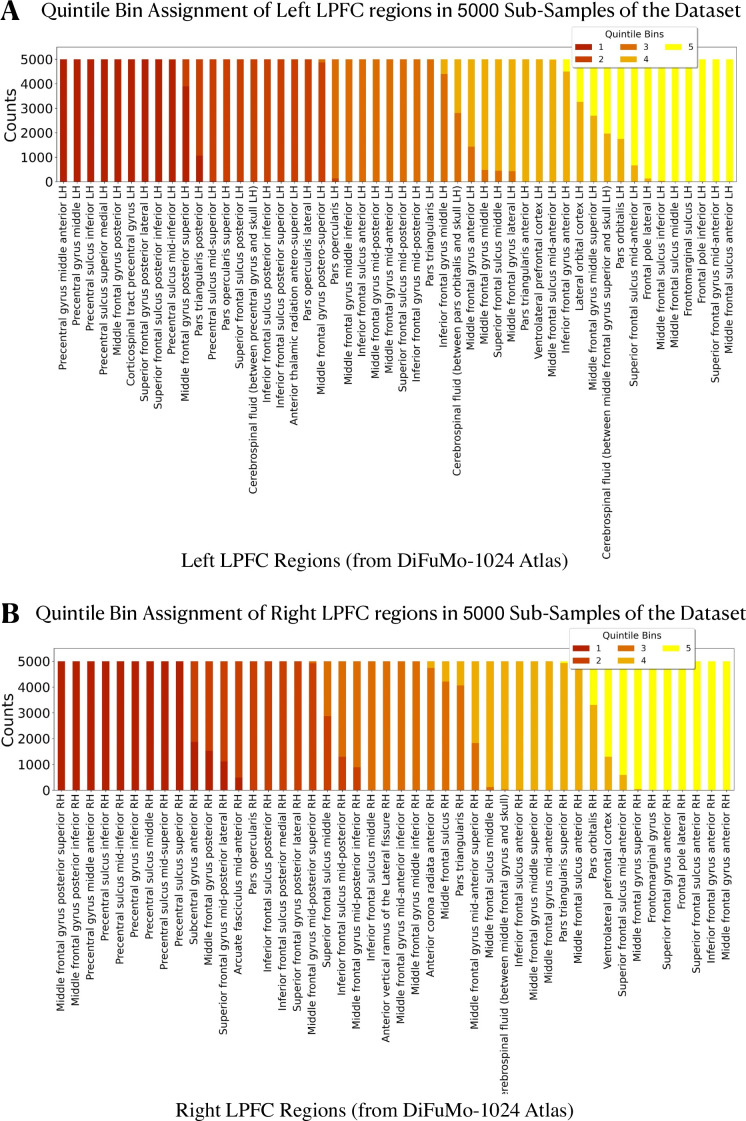
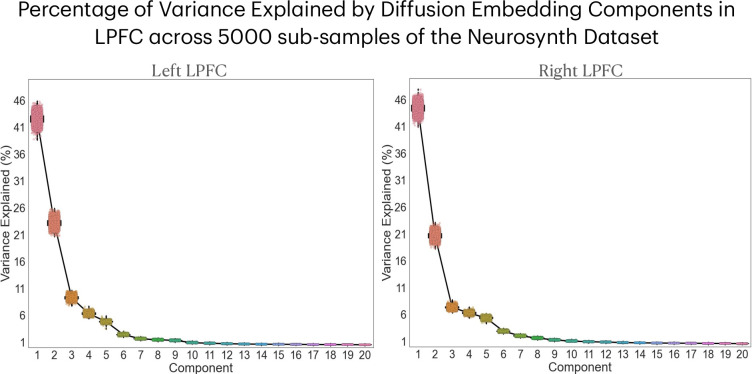
Figure 1—figure supplement 2. Percentage of variance explained by diffusion embedding components across 5000 re-runs of the meta-analysis.

Figure 1—figure supplement 2.

The percentage of variance explained by diffusion embedding components in 5000 re-runs of the meta-analysis on random sub-samples of the Neurosynth dataset in the left and right LPFC. Each dot represents a run on one sub-sample. We observe that the dots cluster together for each component, indicating small variations in the percentage of variance explained across different runs of the meta-analysis.
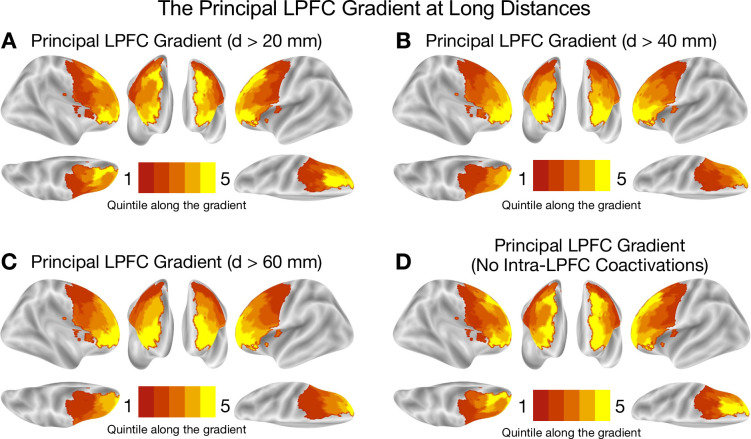
Figure 1—figure supplement 3. The principal LPFC gradient of long range coactivations.

Figure 1—figure supplement 3.

The principal LPFC gradient of long range coactivations. (A), (B), (C) show the principal LPFC gradient when only taking into account regions that are at least 20 mm, 40 mm, or 60 mm apart, respectively. The coactivation distance is the Euclidean distance between the centers of mass of regions. (D) shows the principal LPFC gradient when not taking into account any intra-LPFC coactivations. The results of this analysis show that, despite changes in the shape of the gradient when varying the coactivation distance, the gross rostrocaudal spatial layout is preserved. These results suggest that the spatial layout of the principal LPFC gradient is not driven by the spatial auto-correlation among nearby LPFC regions.
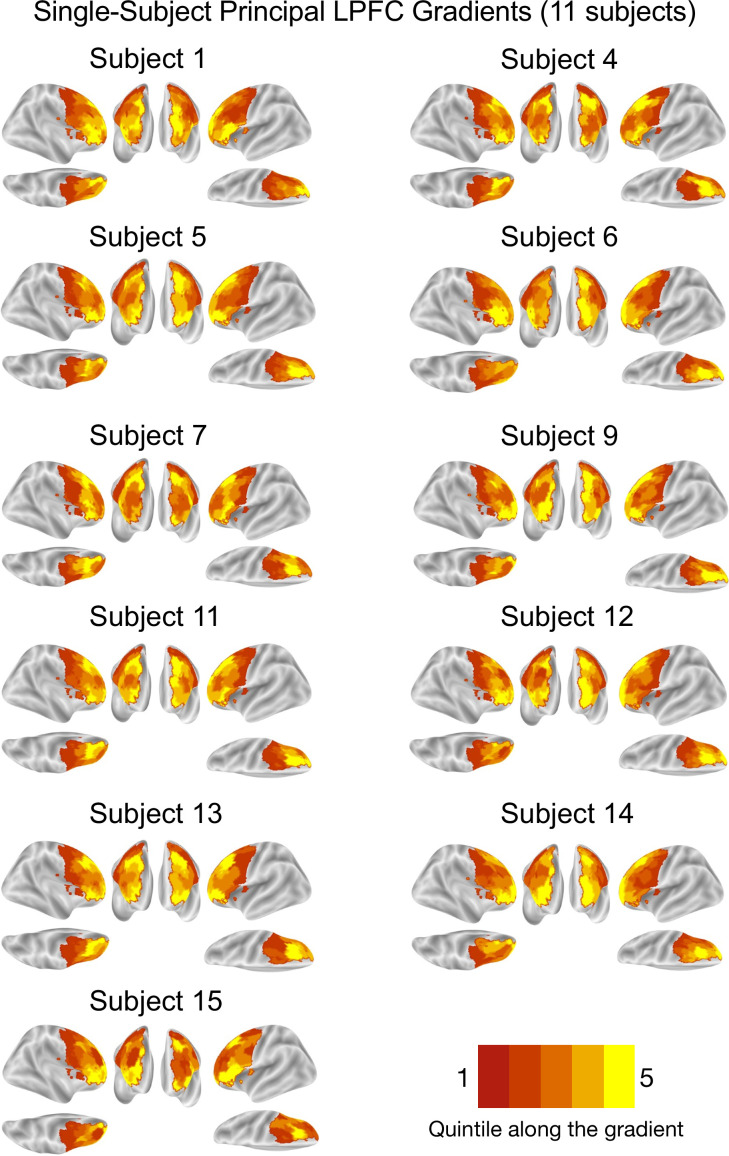
Figure 1—figure supplement 4. The principal LPFC gradient at the single-subject level.

Figure 1—figure supplement 4.

The principal LPFC gradient at the single-subject level. The subject-level gradients describe changes in coactivation patterns in the LPFC of 11 healthy subjects from the Individual Brain Charting (IBC) dataset. The IBC subjects underwent an extensive set of tasks, which yielded around 750 contrasts per subject. After activation peak extraction, a meta-analysis and a gradient mapping analysis are performed to estimate the gradients. Originally, the dataset included activation maps from 12 participants, but we excluded one participant (‘Subject 8’) for insufficient data available at the time of the study. Note that the labels assigned to the subjects in the original dataset do not include ‘Subject 2’, ‘Subject 3’, and ‘Subject 10’.
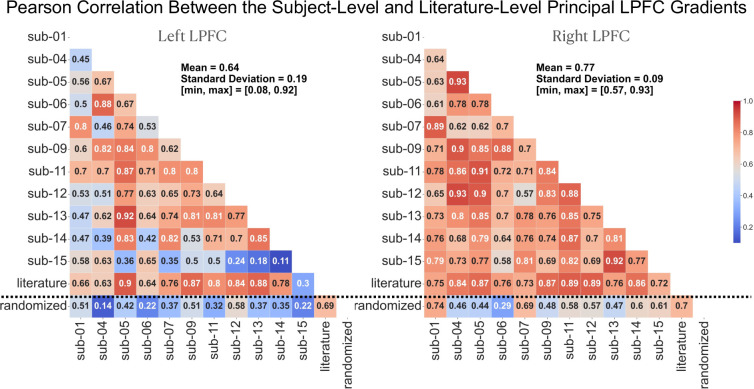
Figure 1—figure supplement 5. Spatial correlation between the subject-level and literature-level LPFC gradients.

Figure 1—figure supplement 5.

Spatial correlation between the subject- and literature-level principal LPFC gradients. (left) and (right): Correlation among the principal gradients of single subjects and the literature in the left and right LPFC, respectively. The last row of each matrix, separated from other rows by a dotted line, encodes the spatial correlation of the gradients with a gradient estimated from a randomized version of the activation data. Randomization is achieved through 1000 random shuffles of the peak coordinates across the 14,371 studies. The results show strong correlation between most subjects’ principal gradients and the literature principal gradient along with a relatively weaker between-subjects correlation. The mean, standard deviation, minimum, and maximum correlation are estimated from correlation values above the dotted line. Finally, the spatial correlations with the gradient of randomized activation data are relatively weak.