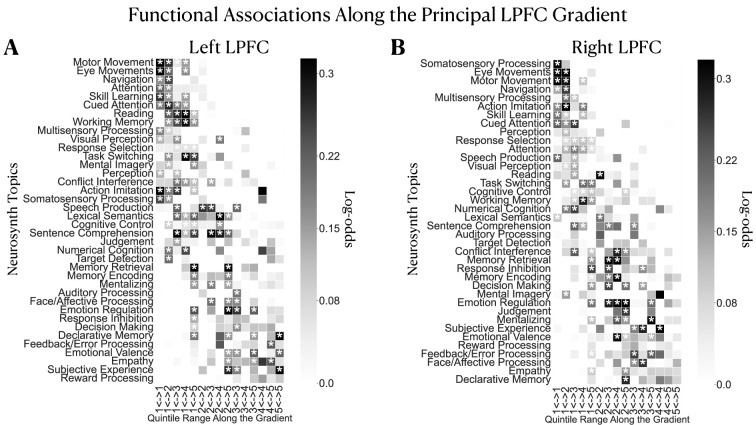
Figure 4. Inferring functional associations along the principal LPFC gradient using segregation queries.
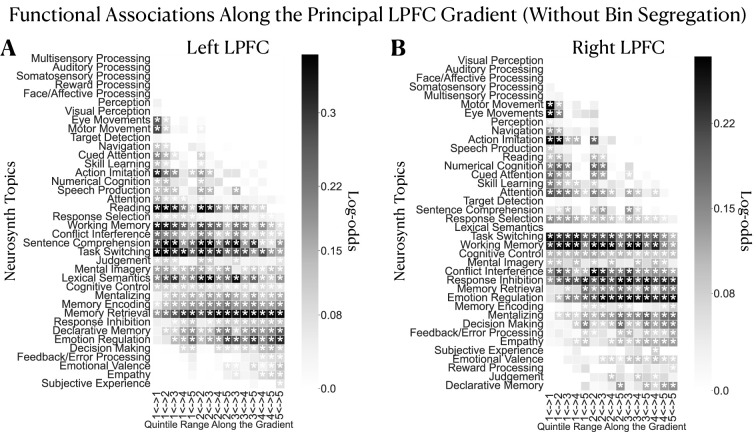
Mapping functional associations using segregation queries reveals a structured ordering of topics along the principal gradient in the (A) left and (B) right LPFC. Topics are ordered by the weighted mean of their location along the principal gradient. Topics of sensorimotor processing are mostly located at the top followed by executive functions and language, and finally emotion/memory/social cognition-related topics mostly occupy the bottom. Note that although the order of topics varies between hemispheres, the general profile of topic associations is comparable. A two-headed arrow along the horizontal axis signifies a coactivation constricted in a given range of quintile bins. Log-odds ratio values are thresholded at 0 to show only positive associations. White asterisks denote the log-odds ratio values whose 95% confidence interval estimated from 5000 re-runs of the meta-analysis on random sub-samples of the Neurosynth dataset does not include the value 0.


