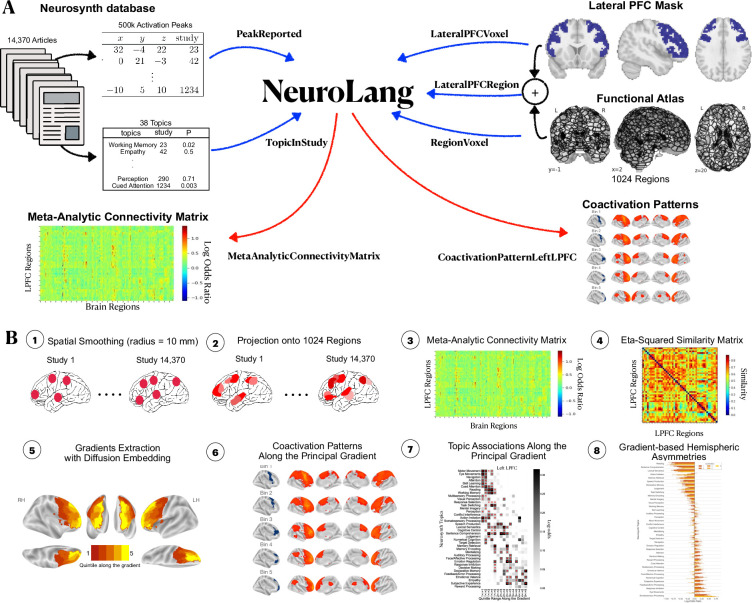
Figure 6. Schematic overview of our analysis pipeline.
(A) Inputs and outputs of NeuroLang. Inputs are represented using blue arrows and include: Peak activations and topics from the Neurosynth dataset, the lateral PFC mask, and the 1024 regions from the DiFuMo atlases are represented in a unifying framework within NeuroLang. Two examples of outputs are shown here and represented using red arrows. (B) The main steps of the meta-analysis carried out in this study. (1) Spatial smoothing with 10 mm kernel around each peak. (2) The binary activation map of each study is projected onto 1024 functional regions. Varying shades of red signify that regions have different probabilities of being reported by a study depending on the location of voxels within each region. (3) The meta-analytic connectivity matrix encodes the log-odds ratios of coactivation between each region in the LPFC and every region in the brain. (4) A similarity matrix encodes the degree of correspondence between LPFC regions in their meta-analytic connectivity profiles, estimated by the eta-squared similarity metric. (5) The principal gradient of meta-analytic connectivity in each hemisphere is then derived from the similarity matrix using diffusion embedding. (6) Coactivation patterns of successive quintile gradient bins are inferred (7) Specific topic associations along the principal gradient are inferred using segregation queries. (8) Finally, a gradient-based meta-analysis of hemispheric asymmetries is performed.

