. 2022 Sep 7;11:e63327. doi: 10.7554/eLife.63327

Figure 1. Detection of experimental horizontal gene transfer (HGT) in vaccinia virus.

(A) VACV lacking E3L and K3L cannot replicate in wild-type RK13 cells, but can replicate in cells stably transfected with mCherry-E3L. Virus that acquired E3L can replicate in wild-type RK13 cells (right). (B) Schematic of the mCherry-E3L vector that was stably transfected into RK13 cells. (C) Schematic of the general genetic architecture of horizontally transferred genes identified in VACV isolates. (D) HGT integration sites in the VACV genome. The VACV genome is represented in blue. Genes highlighted above the genome were described to have likely originated from HGT (Hughes and Friedman, 2005; Bratke and McLysaght, 2008). Features shown below the genome are: integration sites into genes (black boxes, blue lines) or into intergenic regions (red lines). The orientation of the transferred genes is indicated by the arrow, colors of arrows indicate the orientation of mCherry-E3L relative to target genes (blue: same direction; red: opposite direction; black arrow: intergenic). (E) Maps of mCherry-E3L integration sites in HGT1–20. Arrows indicate the direction of transcription for VACV and mCherry-E3L. Intergenic regions are depicted in yellow. The position of an integrated U2 small nuclear RNA and the associated poly(A) tract is shown for HGT20 by dashed lines.

Figure 1.

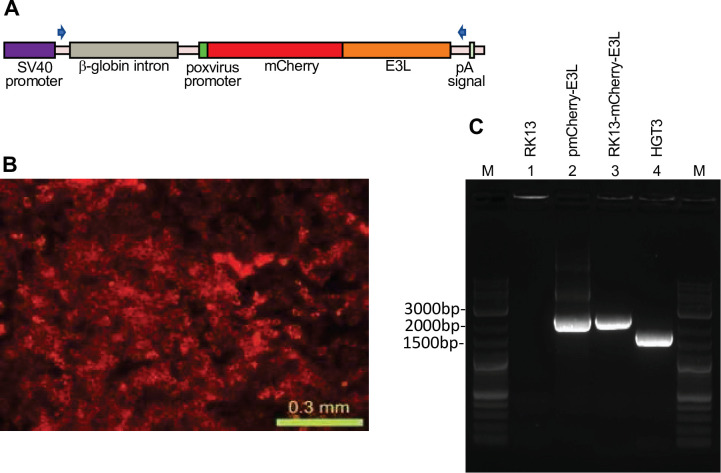
Figure 1—figure supplement 1. Stable expression of mCherry-E3L in RK13 cells.

Figure 1—figure supplement 1.

(A) Map of the expression cassette in the pmCherry-E3L plasmid used to stably transfect RK13 cells. The positions of oligonucleotides used to amplify the parts of the expression cassette are indicated by arrows. (B) Fluorescent micrograph of stably transfected RK13-mCherry-E3L cells. (C) PCR specific for mCherry-E3L did not amplify a product from RK13 cells (lane 1), but amplified comparably sized products from the plasmid pmCherry-E3L (lane 2) and genomic DNA of the RK13-mCherry-E3L cell line (lane 3). A smaller band was amplified from HGT3 DNA due to the spliced-out intron (lane 4). M = molecular weight marker.
Figure 1—figure supplement 1—source data 1. PCR for mCherry-E3L.
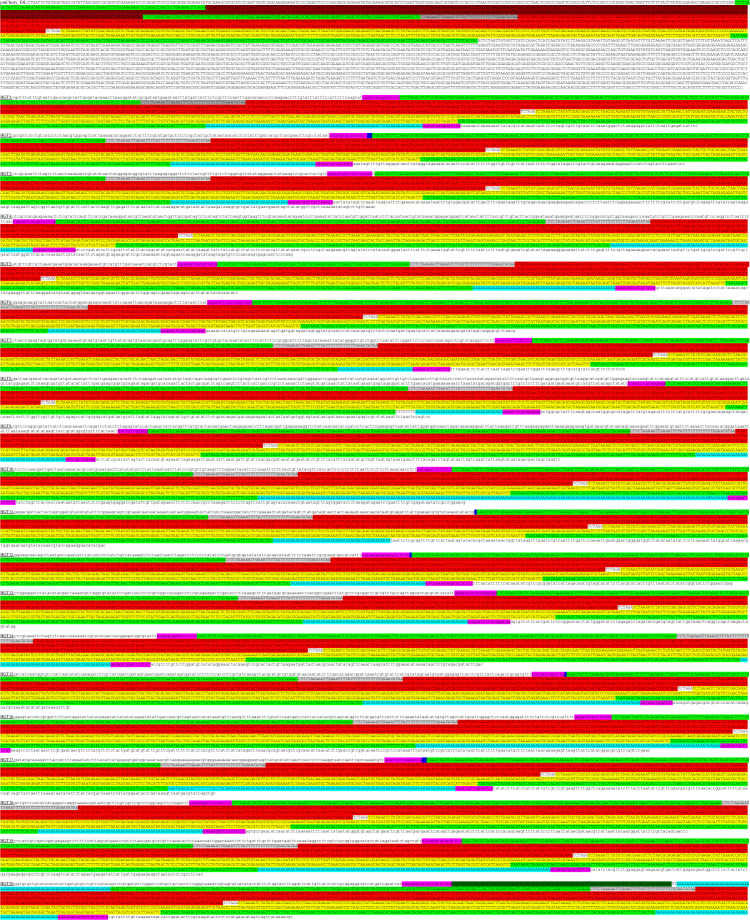
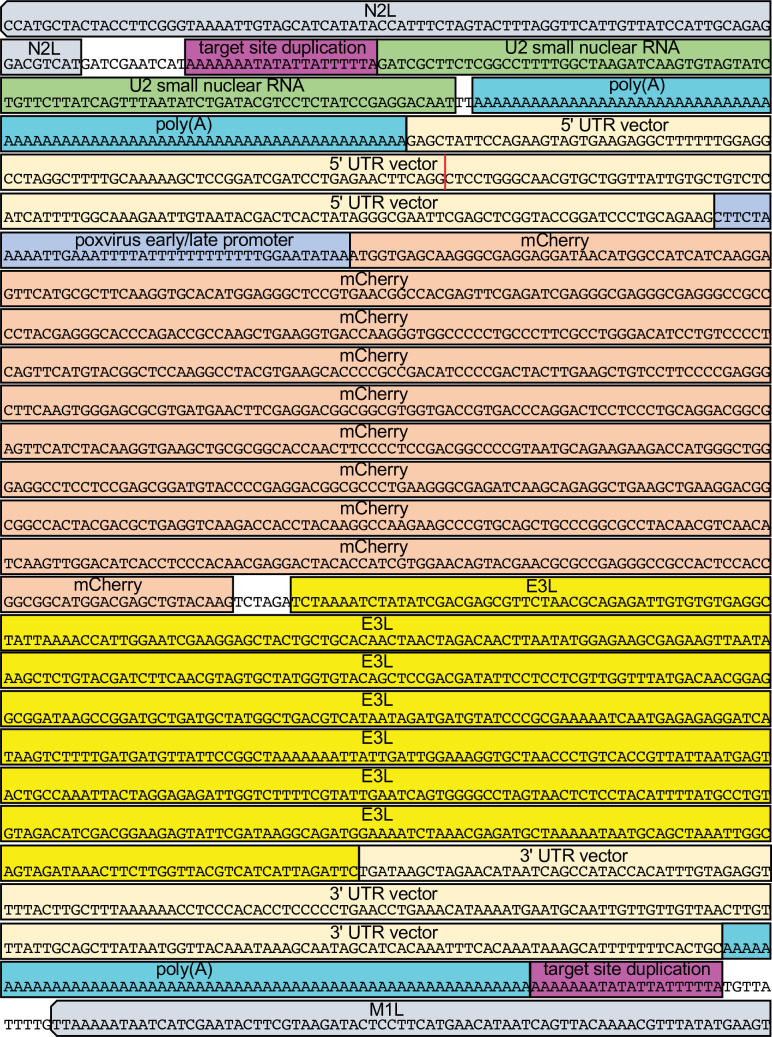
Figure 1—figure supplement 2. Sequences of the pmCherry-E3L plasmid, VACV genomic sequences surrounding the integration sites and the integrated genes in HGT1–20.

Figure 1—figure supplement 2.

The 5′ and 3′ UTR of the mCherry-E3L gene are shown in light green. Dark red indicates the rabbit β-globin intron. A synthetic early/late poxvirus promoter sequence is marked in gray. mCherry is shown in red. E3L is highlighted in yellow. poly(A) tracts are shown in turquoise. VACV genomic sequences surrounding the integration sites in HGT1 through 20 are shown in lower case letters. Blue shades highlight untemplated nucleotides 5′ of the 5′ UTR. Target site duplications at the mCherry-E3L integration sites are indicated in pink. For HGT20, dark green indicates a fragment of a U2 small nuclear RNA encoding sequence. For HGT1–20, sequences from Sanger sequencing of PCR products are shown. Note that the poly(A) tracts were not completely sequenced and might contain sequencing errors due to problems with sequencing of long mononucleotide stretches and possible heterogeneity in the population.
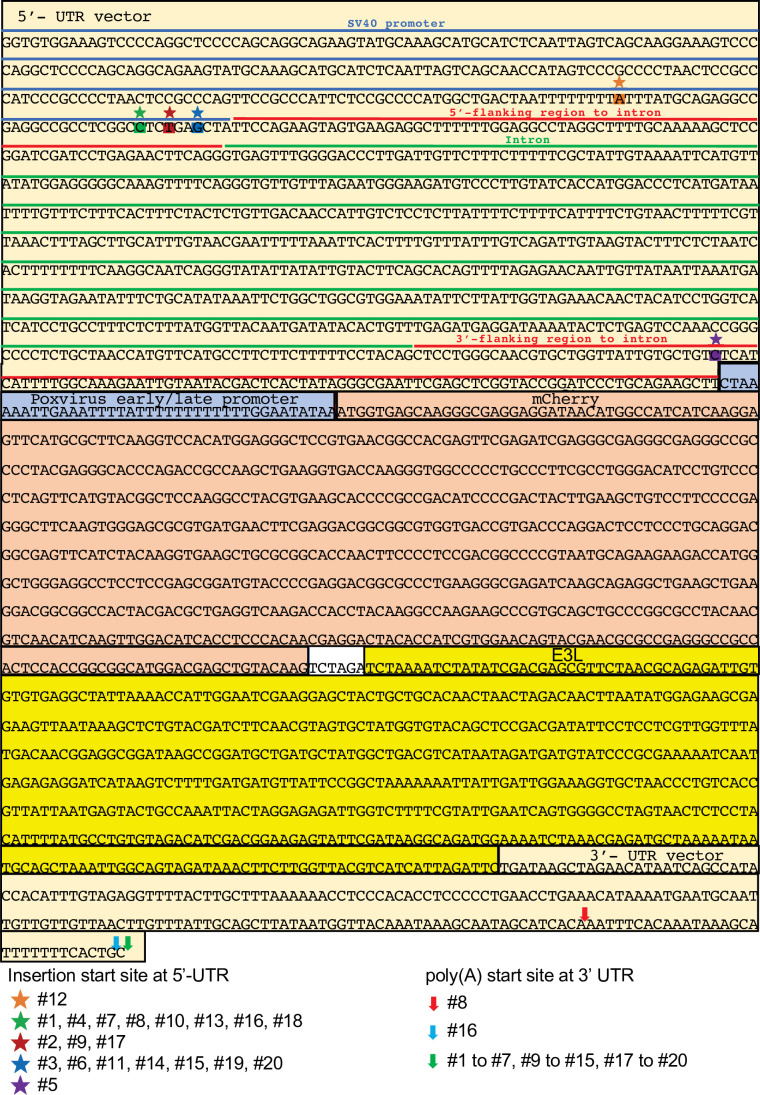
Figure 1—figure supplement 3. Map of pmCherry-E3L.

Figure 1—figure supplement 3.

Insertion start sites and polyadenylation sites of transgenes in horizontal gene transfer (HGT) viruses #1 to #20 are indicated.
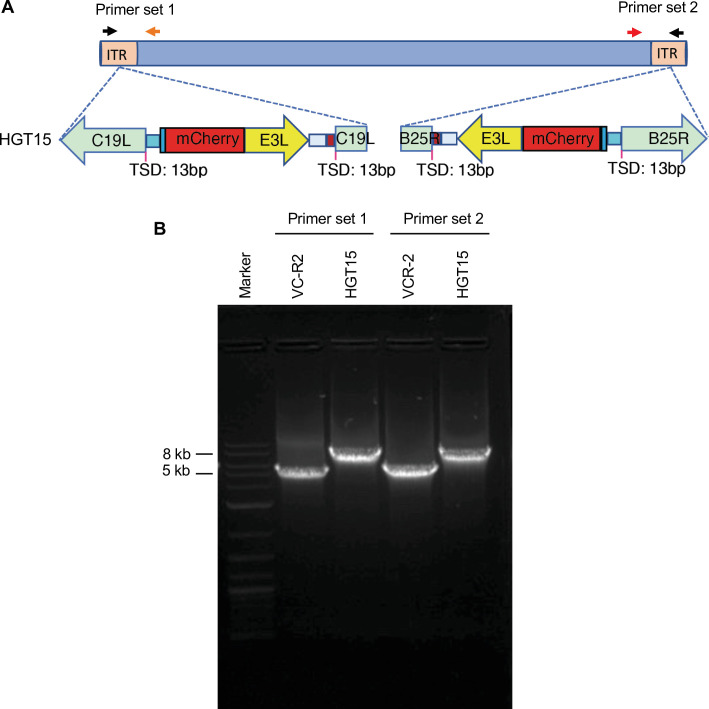
Figure 1—figure supplement 4. HGT15 contains one mCherry-E3L copy in each inverted terminal repeat (ITR).

Figure 1—figure supplement 4.

(A) To determine whether mCherry-E3L was present in both ITRs or only in one, primers were designed to span the integration site and the unique region outside of the ITR. (B) Both primer sets yielded larger PCR products for HGT15 than for the parental VC-R2, indicating that mCherry-E3L was present in both ITRs.
Figure 1—figure supplement 4—source data 1. PCR with primers spanning the mCherry-E3L integration site in HGT15 in comparison to VC-R2.
Figure 1—figure supplement 5. Integration site and composition of the U2-mCherry/E3L fusion in HGT20.

Figure 1—figure supplement 5.