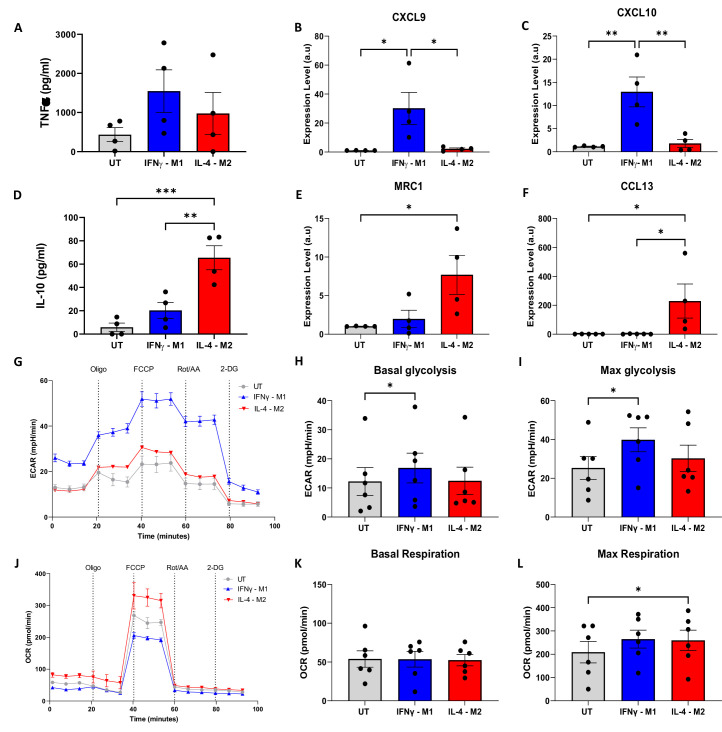
Figure 2. Validation of macrophage polarisation and metabolic profiling of IFNγ-M1, IL-4-M2, and untreated (UT) macrophages.
(A, B) ELISA of inflammatory cytokine TNFα and anti-inflammatory IL-10 in IFNγ-M1, IL-4-M2, and UT macrophages. (C–F) Evaluation of CXCL9, MRC1, CXCL10, and CCL13 gene expression in IFNγ-M1, IL-4-M2, and UT macrophages. (G,J ) Extracellular acidification ratio (ECAR) and oxygen consumption ratio (OCR) profile of IFNγ-M1, IL-4-M2, and UT macrophages when treated sequentially with oligomycin, carbonyl cyanide-p-trifluoromethoxyphenylhydrazone (FCCP), rotenone + antimycin A, and 2-deoxy-d-glucose (2-DG). (H, I, K, L) Area under the curve (AUC) values calculated from ECAR and OCR between each treatment. Data displayed as average ± SD. Statistical significance verified by one-way ANOVA with *p<0.05, **p<0.01, ***p<0.001 to show significance for N = 6 donors.


