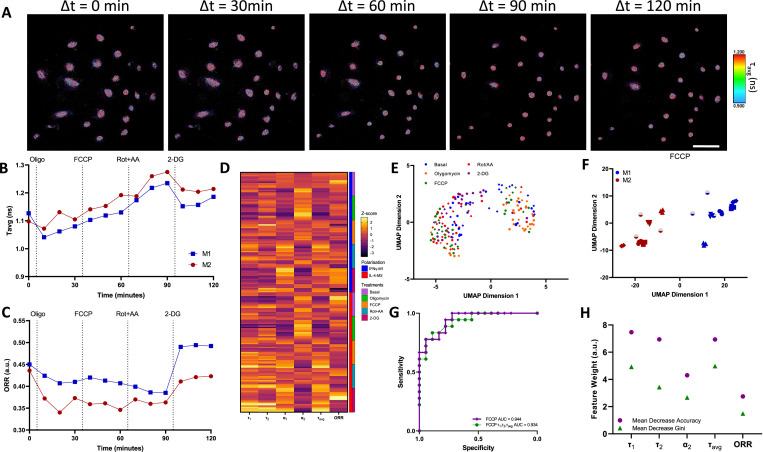
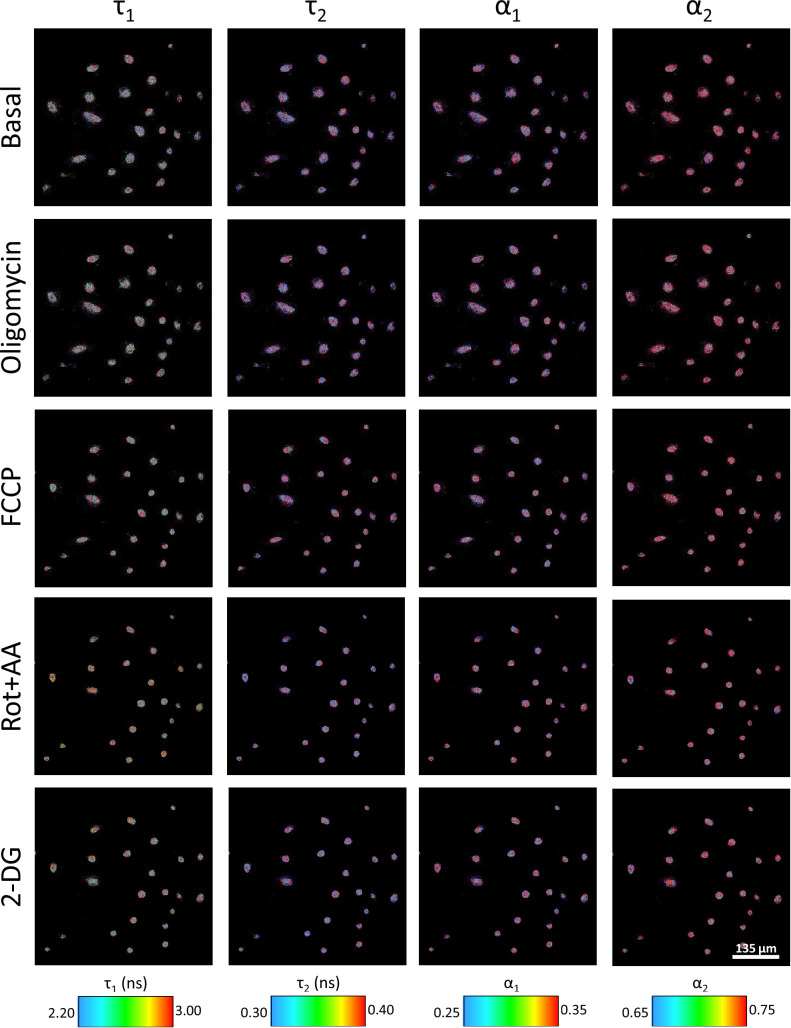
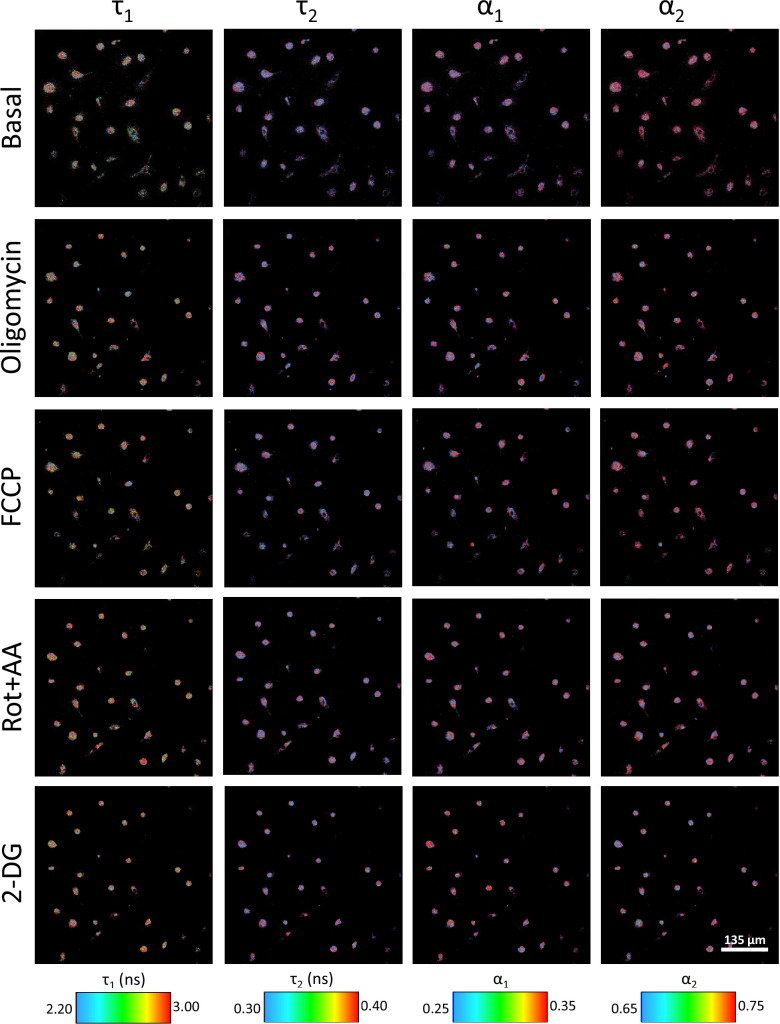
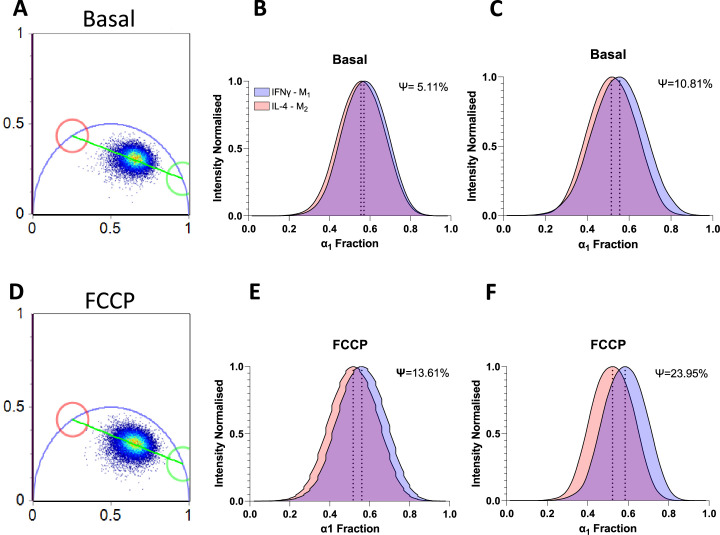
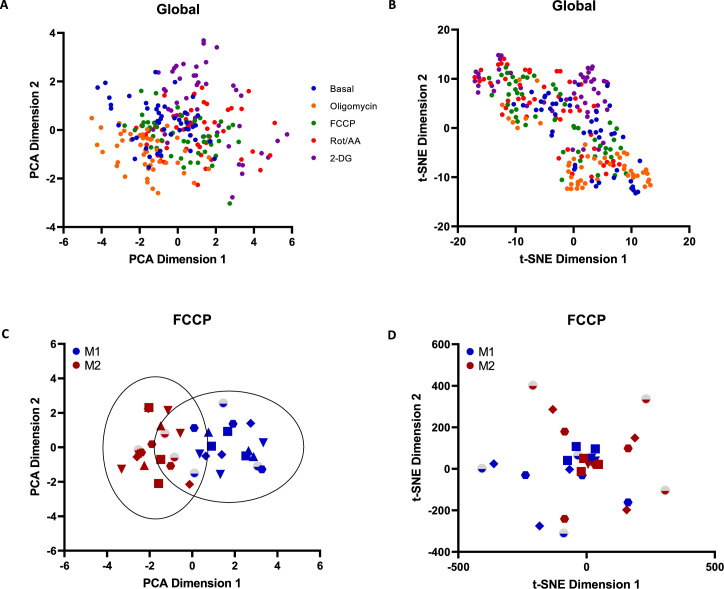
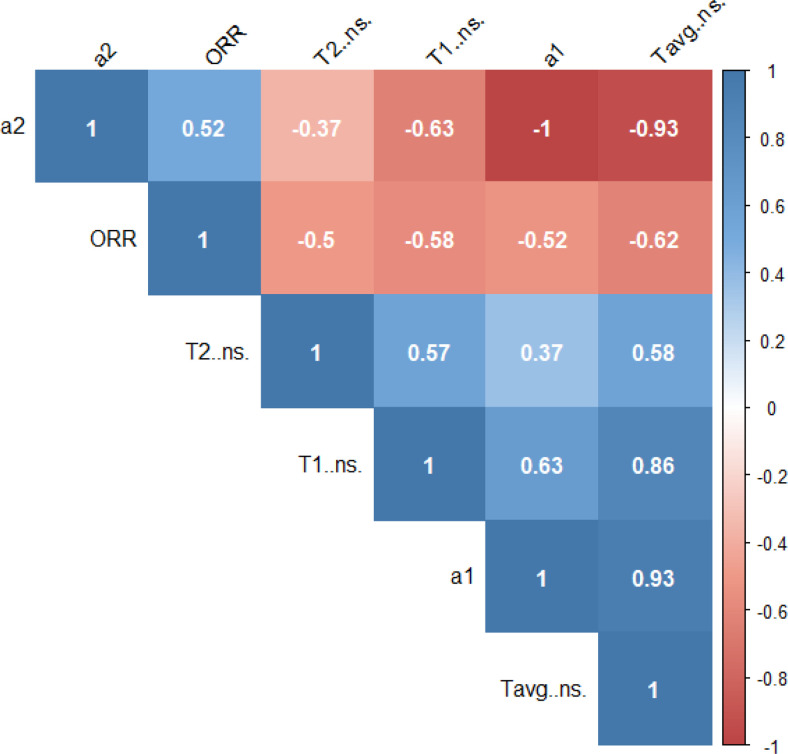
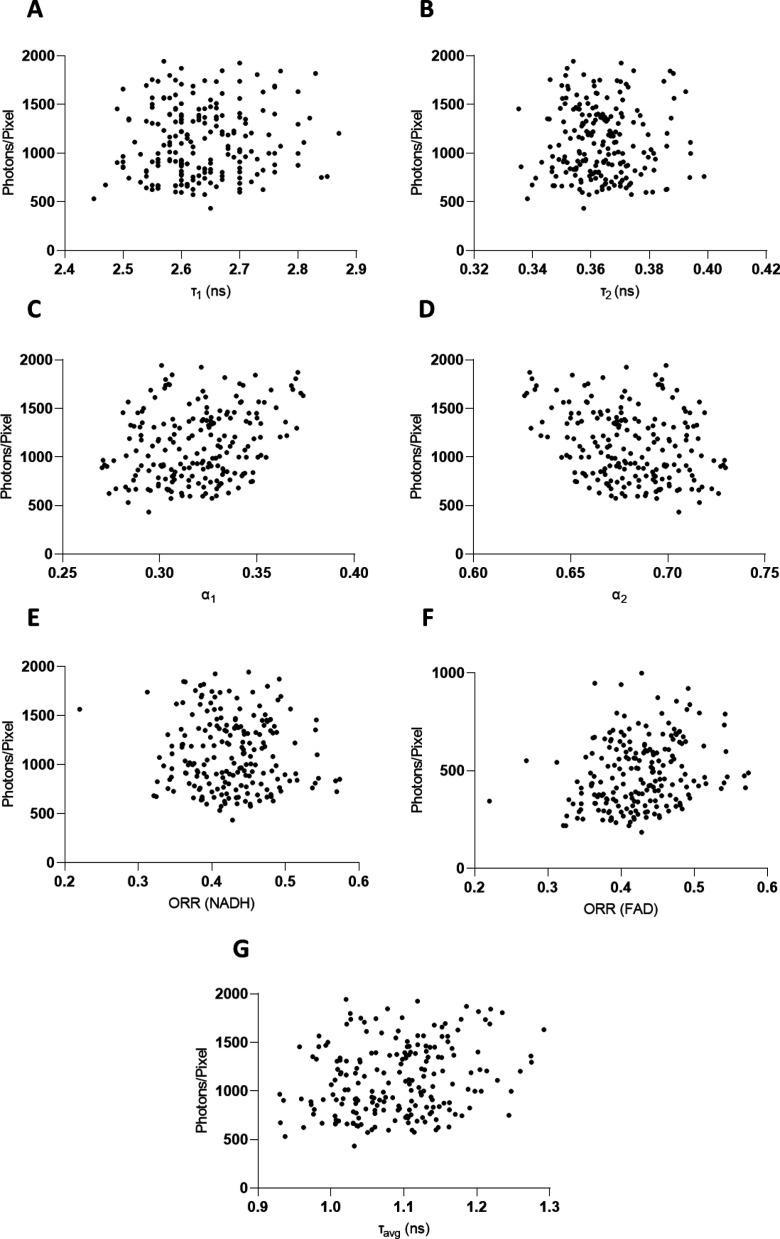
Figure 3. Two-photon fluorescence lifetime imaging microscopy (2P-FLIM) metabolimaging analysis.
(A) Time-course imaging of representative (same field of view throughout) IFNγ-M1 macrophages, scale bar: 100 μm. (B, C) Average fluorescence lifetime (τavg) and optical redox ratio (ORR) values for IFNγ-M1 and IL-4-M2 when treated sequentially with oligomycin, carbonyl cyanide-p-trifluoromethoxyphenylhydrazone (FCCP), rotenone + antimycin A and 2-deoxy-d-glucose (2-DG) of a representative donor. (D) z-score heatmap of 2P-FLIM acquired data for six donors separated by macrophage polarisation and metabolic inhibitor, each individual row corresponds to an imaging field. (E) Uniform Manifold Approximate and Projection (UMAP) plot of 2P-FLIM variables after each treatment each dot corresponds to an individual imaging field. (F) UMAP plot of 2P-FLIM variables after FCCP treatment, each dot corresponds to an individual imaging field. (G) Receiver-operator curve and area under curve values of random forests machine learning model applied to 2P-FLIM data after FCCP treatment. (H) 2P-FLIM weight features determined by mean decrease accuracy and mean decrease Gini of random forests model used to classify macrophages.

