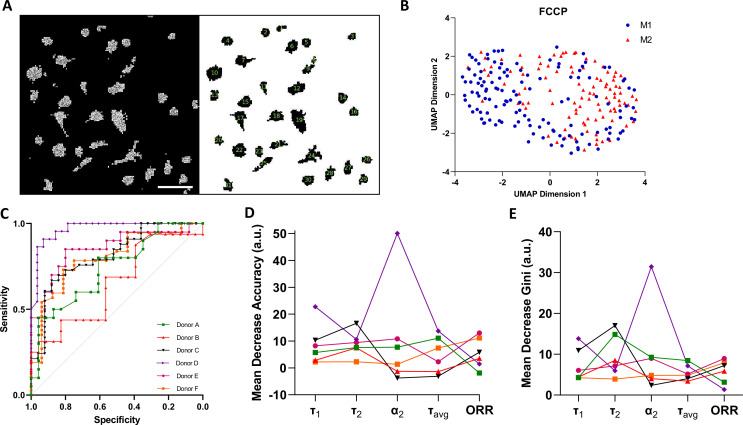
Figure 4. Single-cell two-photon fluorescence lifetime imaging microscopy (2P-FLIM) imaging analysis.
(A) Single-cell analysis using a custom-built Cell Profiler script, scale bar = 100 µm. (B) Single-cell Uniform Manifold Approximate and Projection (UMAP) visualisation of a representative donor after carbonyl cyanide-p-trifluoromethoxyphenylhydrazone (FCCP) treatment using 2P-FLIM variables. (C) Receiver operating characteristics curve (ROCs) of random forests models for classification of macrophages of all human donors used in this study. (D) Mean decrease in accuracy and (E) mean decrease in Gini of each 2P-FLIM variable returned by the random forests model.

