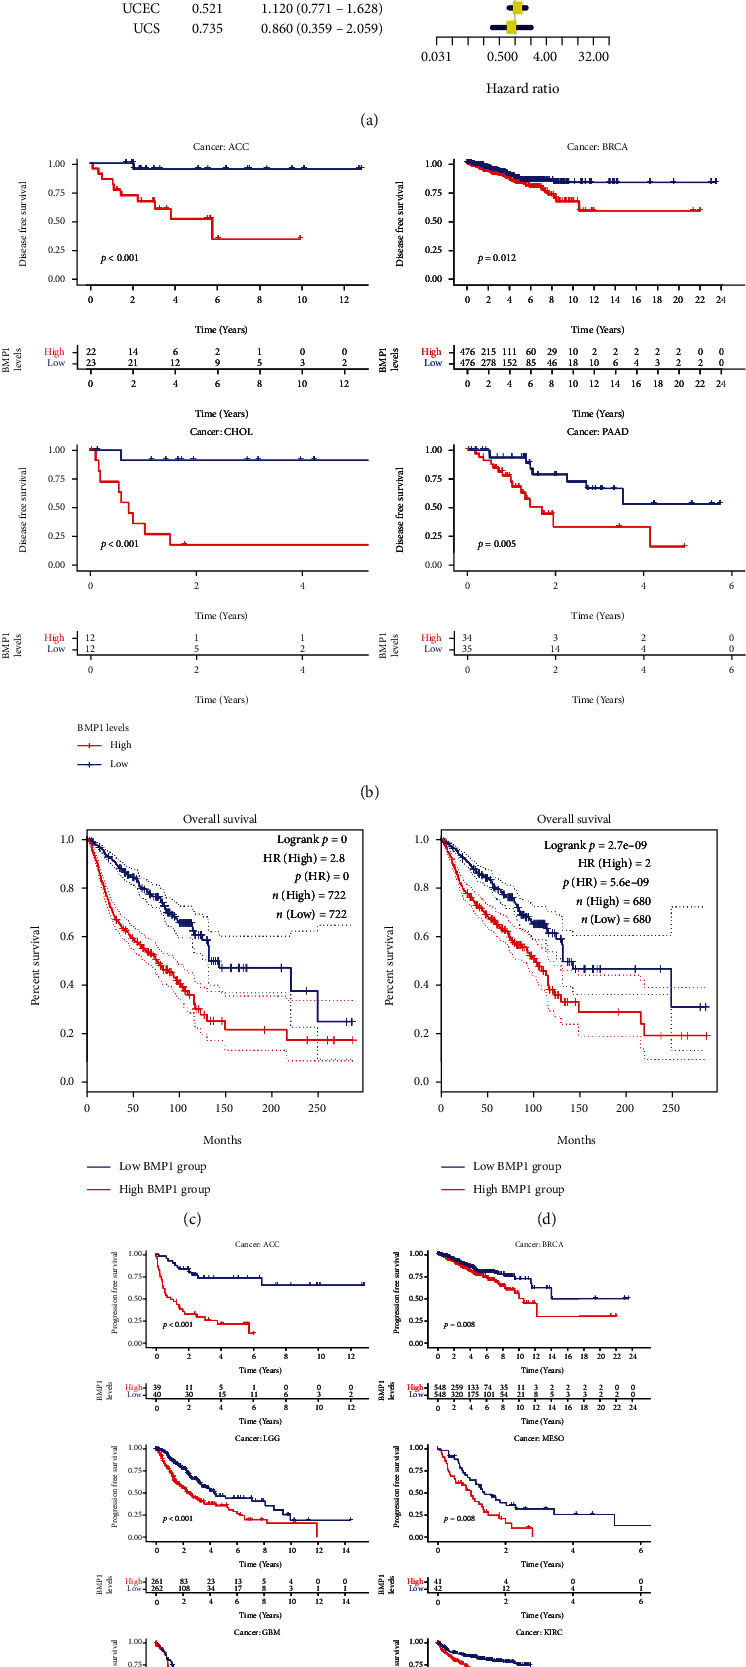
Figure 3.

The correlation between BMP1 and disease-free survival (DFS). (a) The forest plot was conducted using “forestplot” package. The yellow marks meant the cancers with significant association between BMP1 and prognostic indicators. (b) The survival plots were presented based on the Kaplan–Meier survival methods. (c) The DFS of 5 cancers based on the forest plot using GEPIA data, and (d) 4 types of cancers based on K–M plot using GEPIA data. (e) The progression-free survival (PFS) of pancancer was utilized by Kaplan–Meier survival methods based on R package, considering p value <0.05 as significant difference.
