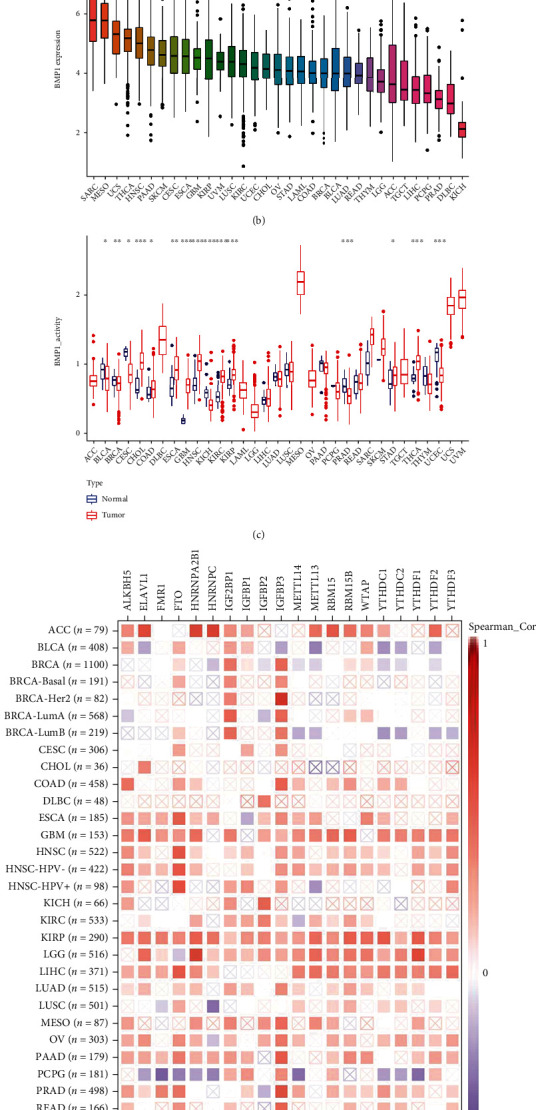
Figure 4.

The investigation of gene activity (a–c) and correlation between BMP1 expression and m6A-related factors (d). (a) Mean activity in 33 types of carcinomas. (b) Mean expression in 33 types of carcinomas. (c) Differential activity analysis in tumor groups versus normal groups. (d) The correlation between the gene and m6A markers based on TIMER2 platform (∗p < 0.05; ∗∗p < 0.01; and ∗∗∗p < 0.001).
