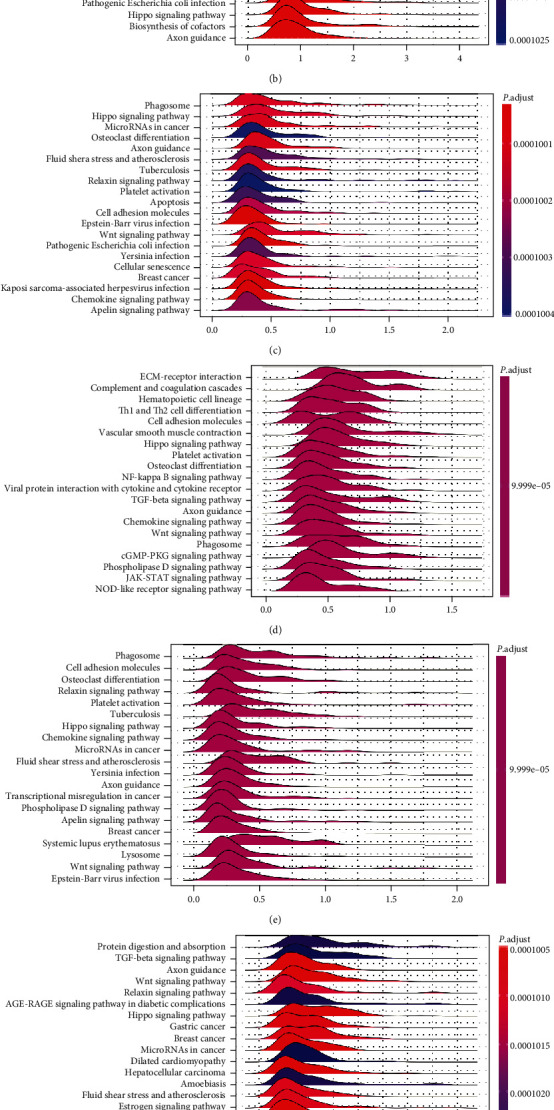
Figure 8.

The Kyoto Encyclopedia of Genes and Genomes (KEGG) pathway enrichment analysis based on GSEA. Each ridgeline plot represented KEGG pathways in corresponding cancer, plotted by enrichment score on the horizontal axis and KEGG pathways on the vertical. (a)ACC; (b)KICH; (c)PAAD; (d)PRAD; (e)READ; (f)TGCT; and (g)UVM.
