
Figure 2.
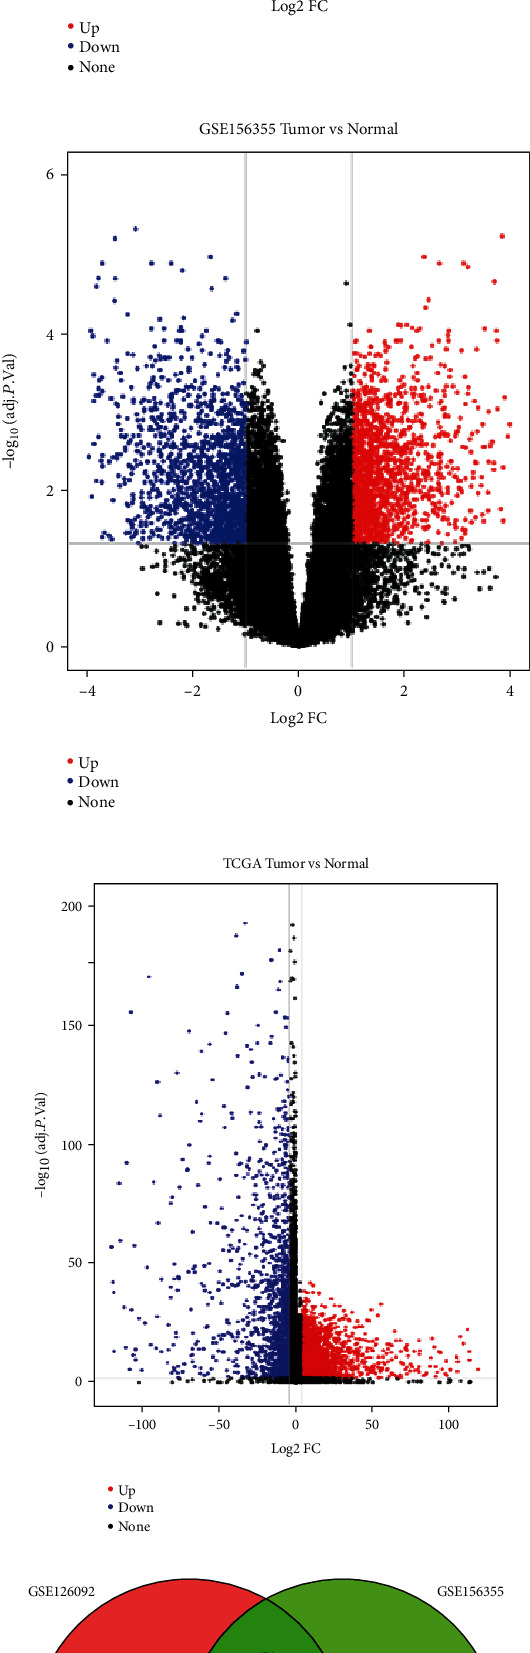
Identification of overlapping DEGs of CRC. (a) Volcano plot of DEGs in GSE126092 between CRC tissues and paired adjacent noncancerous tissues. A total of 3,022 DEGs were identified with red dots or blue dots in the plot. (b) Volcano plot of DEGs in GSE156355 identified 3,356 DEGs. (c) Volcano plot of DEGs in TCGA identified 3,926 DEGs. (d) Venn graph of overlapping DEGs among these three data sets. A total of 330 DEGs in all three independent cohorts were identified, and this indicated that these genes were present in all of the three datasets.