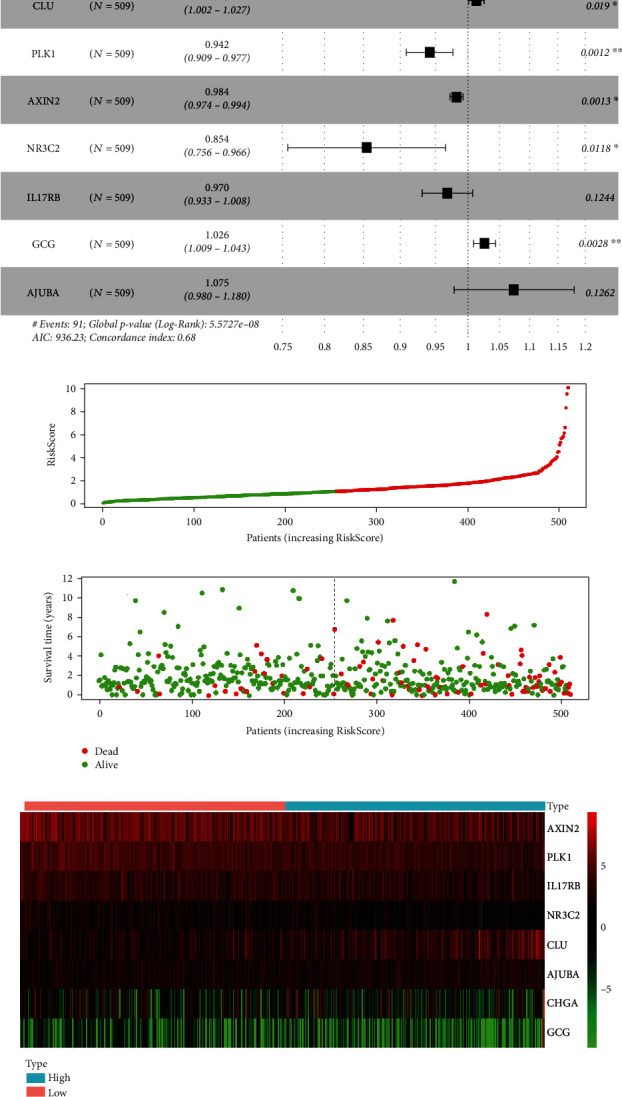
Figure 5.

Construction of the risk model for prognosis of CRC. (a) A visual result of multivariate COX regression analysis forest plot. CHGA, CLU, GCG, and AJUBA were negatively related to the prognosis when HR>1, and PLK1, AXIN2, NR3C2, and IL17RB were positively related to the prognosis when HR<1. (b) The risk score curve of 509 samples of TCGA, where the green curve indicates the low-risk group with lower RiskScore than the median risk score, and the red curve indicates the high-risk group with a higher RiskScore. (c) The survival time distribution map indicated that the patients with higher RiskScore values exhibited relatively shorter survival times and higher mortality rates (red dots indicate death). (d) The heatmap of prognostic genes for low-risk and high-risk groups where the 8 target genes were differentially expressed in different groups.
