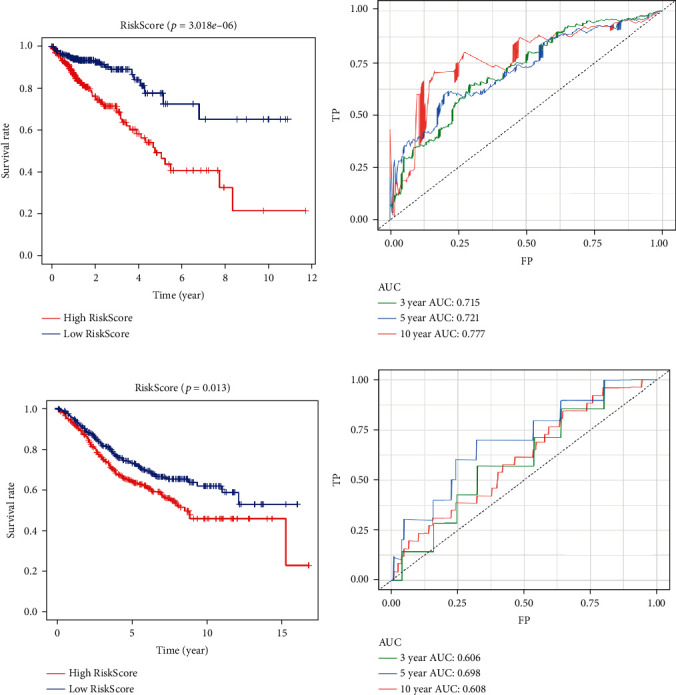
Figure 6.

Evaluation of the prognostic risk model for CRC. (a) Survival curves of the high-risk group and the low-risk group for 509 samples from the TCGA (Internal data). The low RiskScore group (low-risk group) exhibited a longer survival time. (b) ROC curves for 3- (green curve), 5- (blue curve), and 10-year survival (red curve) for 509 CRC samples from the TCGA database. (c) Survival curves of high-risk group and low-risk group for GSE39582 (external data). The low RiskScore group (low-risk group) exhibited a longer survival time. (d) ROC curves for 3- (green curve), 5- (blue curve), and 10-year survival (red curve) for samples from GSE39582.
