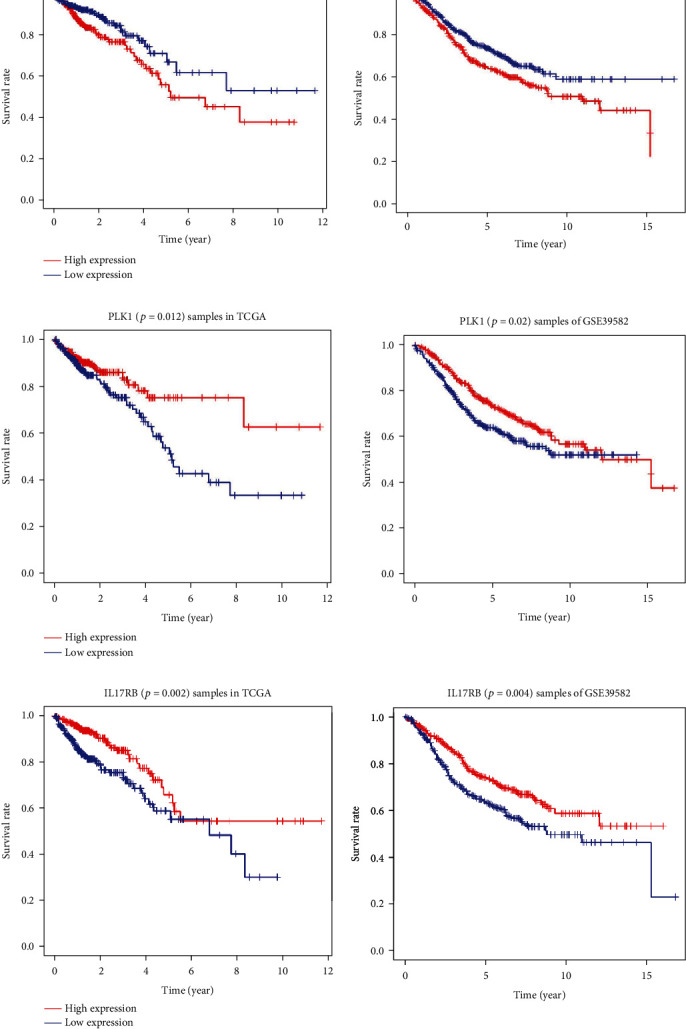
Figure 7.

Survival curves of the high-risk group and the low-risk group for samples from the TCGA or GSE39582 that were divided by the median value of the expression of CLU, PLK1, IL17RB, respectively. (a) Survival curves of the high-risk group and the low-risk group for samples from the TCGA (left side, P = 0.029) or GSE39582 (right side, P = 0.027) that were divided by the median value of the expression of CLU. These values were negatively correlated. (b) Survival curves of the high-risk group and the low-risk group for samples from the TCGA (left side, P = 0.012) or GSE39582 (right side, P = 0.02) for PLK1. These values were positively correlated. (c) Survival curves of the high-risk group and the low-risk group for samples from the TCGA (left side, P = 0.002) or GSE39582 (right side, P = 0.004) for IL17RB. These values were positively correlated.
