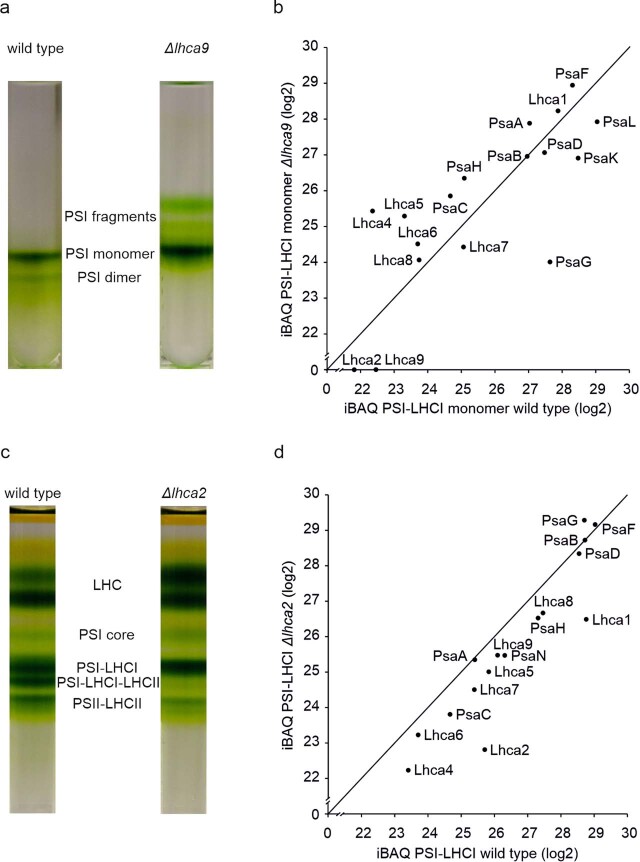
Extended Data Fig. 5. Analysis of Δlhca9 and Δlhca2.
a, Sucrose density gradient of affinity purified PSI from lhca9 insertional mutant (~ 60 µg chl) compared to wild type. b, Quantitative mass spectrometry analysis of the PSI-LHC monomer fraction. iBAQ values are normalized to the PSI core subunit PsaB and values below 21 are excluded as they represent already low intensity values, which might not be reliable. PSI-LHCI subunits PsaE and Lhca3 were not detected at quantifiable intensities in this experiment. Detection of these small PSI and Lhca subunits via mass spectrometry depends on the presence of only a few proteotypic tryptic peptides, which could be missed, as measurements were done in a data dependent fashion (12 MS2 per MS1). c, Sucrose density gradients of α-DDM solubilized thylakoids (~ 250 µg chl) isolated from wild type and lhca2 insertional mutant. d, Quantitative mass spectrometry analysis of the PSI-LHCI fraction in lhca2 insertional mutant. iBAQ values are normalized to the PSI core subunit PsaB and values below 21 are excluded as they represent already low intensity values, which might not be reliable. PSI-LHCI subunits PsaE, PsaK and Lhca3 were not detected at quantifiable intensities in this experiment. Detection of these small PSI and Lhca subunits via mass spectrometry depends on the presence of only a few proteotypic tryptic peptides, which could be missed, as measurements were done in a data dependent fashion (12 MS2 per MS1). Gradients in panel a and c are representative of n = 3 independently performed respective experiments with similar results.

