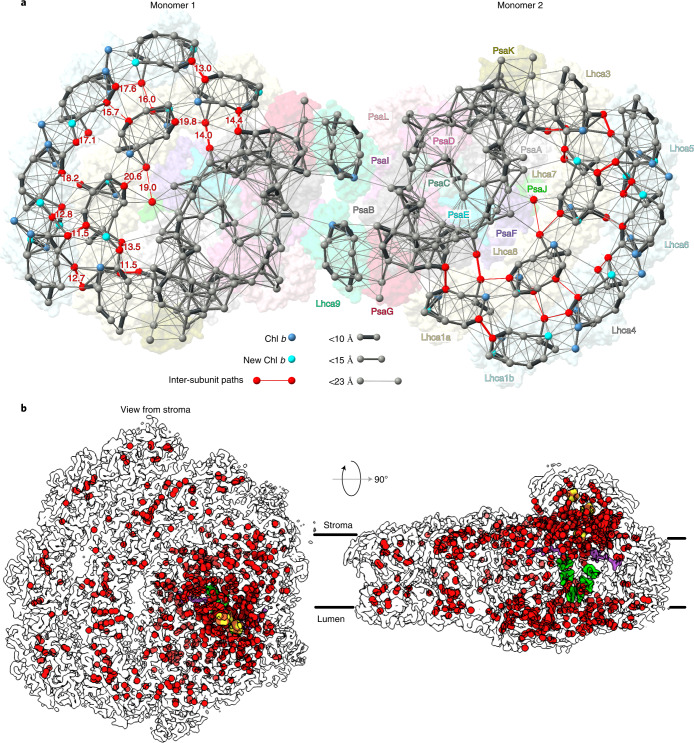
Fig. 4. High-resolution features of co-factors and hydration.
a, Energy transfer pathways. Distribution of chlorophylls indicated by Mg atoms. Chl a is grey, Chl b blue and newly identified Chl b cyan. Pathways within 23 Å are connected by lines, and the line width reflects the distance. The most likely inter-subunit pathways are red. b, Water molecules modelled in PSI are shown as red spheres (oxygen atoms) in the outline of the map, chlorophylls green, phylloquinones purple and iron–sulfur clusters yellow-red.

