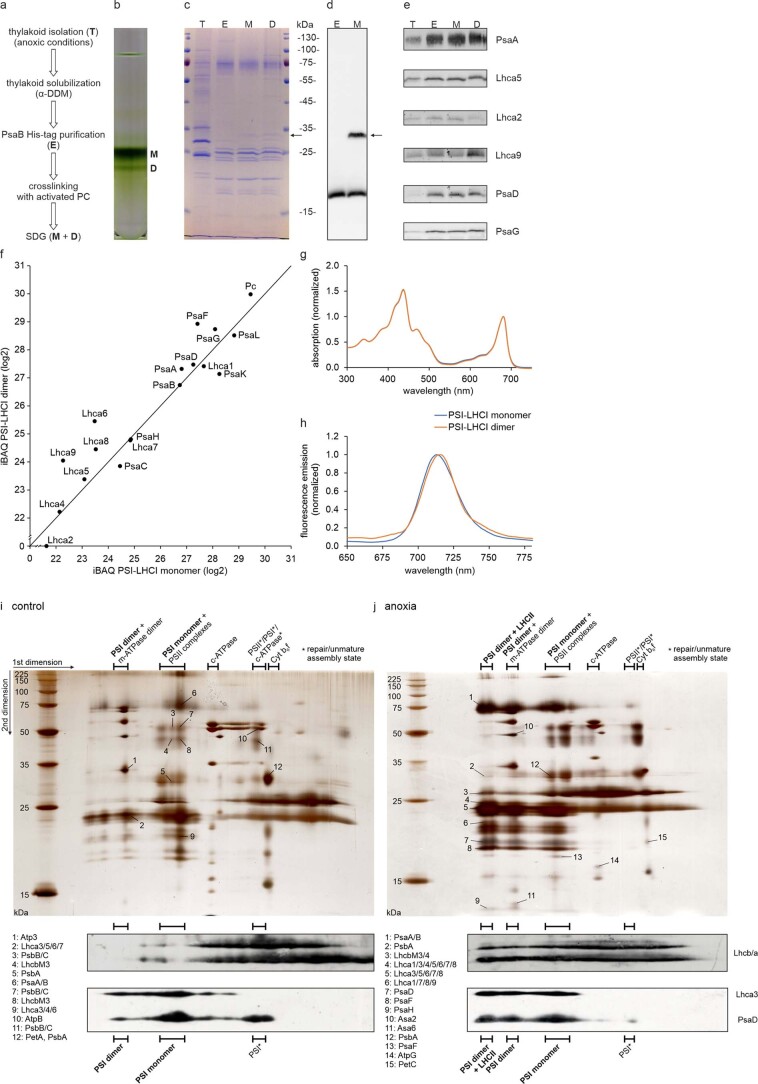
Extended Data Fig. 1. Sample preparation and characterization.
a, The experimental workflow. b, Sucrose density gradient affinity purified PSI (~ 60 µg chl). Monomer (M) and dimer (D) fractions are indicated. c, SDS-PAGE analysis (1 µg chl). T: thylakoids; E: PsaB-His elution, M: PSI monomer, D: PSI dimer. The arrow indicates a putative PsaF-Pc crosslinked product. d, SDS-PAGE and Western Blot against PsaF confirming the cross-linking with Pc. e, SDS-PAGE and Western Blot against PsaA, Lhca5, Lhca2, Lhca9, PsaD and PsaG confirming the presence of small PSI subunits as well as LHCI subunits from both sides of the PSI core. f, Quantitative mass spectrometry analysis of the PSI fractions from (b). iBAQ values are normalized to the PSI core subunit PsaB and values below 21 are excluded as they represent already low intensity values, which might not be reliable. PSI-LHCI subunits PsaE and Lhca3 were not detected at quantifiable intensities in this experiment. Detection of these small PSI and Lhca subunits via mass spectrometry depends on the presence of only a few proteotypic tryptic peptides, which could be missed, as measurements were done in a data dependent fashion (12 MS2 per MS1). g, Room temperature absorption spectra of PSI monomer and dimer fractions. The spectra are normalized to the red region. h, Low temperature (77 K) fluorescence emission spectra of PSI monomer and dimer fractions upon excitation of chlorophyll a at 436 nm. The spectra are normalized to the maximum of the emission peaks and smoothed according to Savitzky-Golay78 using the Jasco spectra analysis program. Data in panel b to h is representative of n = 3 independently performed experiments with similar results. Notably, the presence of PsaH in the dimer sample, but its absence in the cryo-EM structure, indicates that PsaH is only loosely attached to the PSI dimer and readily lost during the cryo-EM analyses. i, 2D-PAGE of β-DDM solubilized C. reinhardtii wild type thylakoids, control conditions. j, low light and anoxic conditions. In the first dimension, multi-protein complexes were separated in their native form by blue native PAGE. In the second dimension, subunits of these protein complexes were separated by SDS-PAGE. “PSII complexes” refers to PSII complexes of different molecular weight due to varying extents of LHCII association. Labelled silver-stained spots were subjected to LC-MS/MS analysis. For convenience, the figure includes a condensed list of representative subunits. For a list of proteins identified in the respective spots, refer to Supplementary Information Dataset 1. Western Blots of Lhcb/a, Lhca3 and PsaD indicate the distribution of LHCII, LHCI and the PSI core. Data in panels i and j is representative of n = 3 independently performed experiments with similar results.

