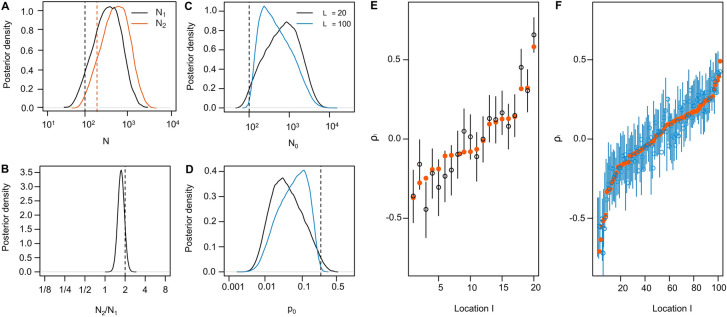
Fig. 5.
Inferring relative abundances under the models presented in Box 3. A–B: Posterior estimates of abundances from data simulated for five visits per location with and and detection probability (dashed vertical lines). B: Posterior distribution of the relative abundance of from the data of A. C–F: Posterior distributions on (C), (D) and the relative abundances (E and F, mean and 90% quantile, true values as orange dots) for each location under the multi-location relative abundance model outlined in Box 3 and from data simulated with , , and and either (black, E) or (blue, F)

