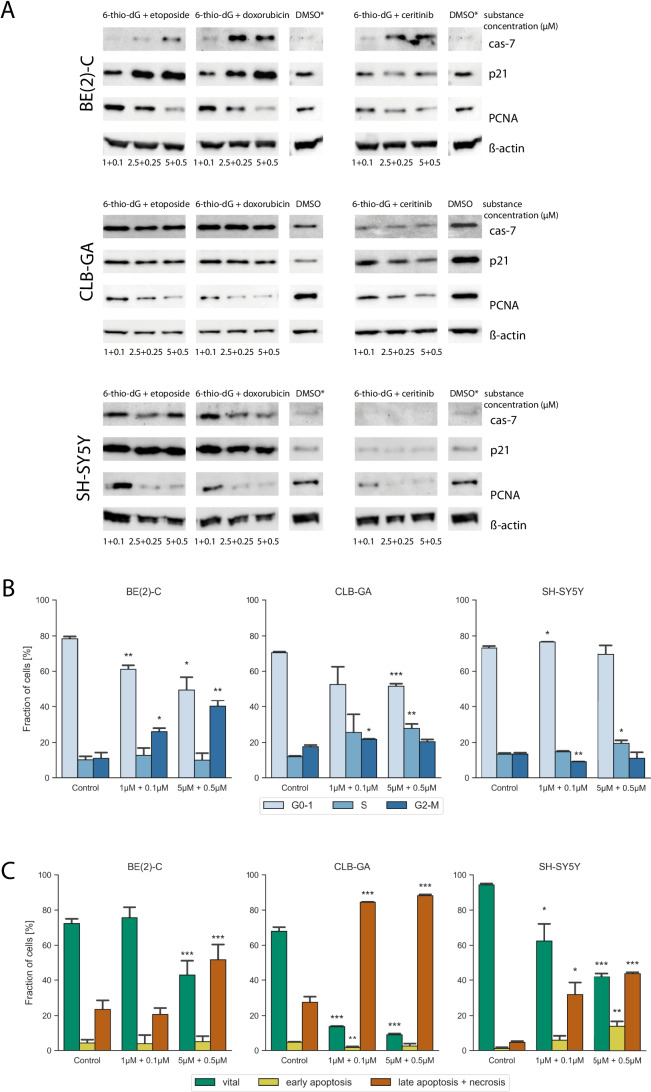
Fig. 2.
A Western blot analysis of cleaved caspase-7, p21Waf1/Cip1, and PCNA in cell-lines BE(2)-C, CLB-GA and SH-SY5Y after 48 h of the indicated treatment combinations or DMSO; ß-actin was used as loading control. Asterisks indicate identical DMSO markers on one membrane. B Cell cycle analysis as determined by flow cytometry, showing G0/G1- (light blue), S- (blue) and G2/M-phase (dark blue) in CLB-GA, SH-SY5Y and BE(2)-C after treatment with 6-thio-dG and etoposide or control for 48 h. C Annexin/PI flow cytometry analysis showing vital cells (green), early apoptosis (yellow) and late apoptosis with necrosis (orange) in CLB-GA, SH-SY5Y and BE(2)-C after a treatment with 6-thio-dG and etoposide or control for 48 h. P-Values are indicated by asterisks; (*) p < 0.05, (**) p < 0.01, (***) p < 0.001

