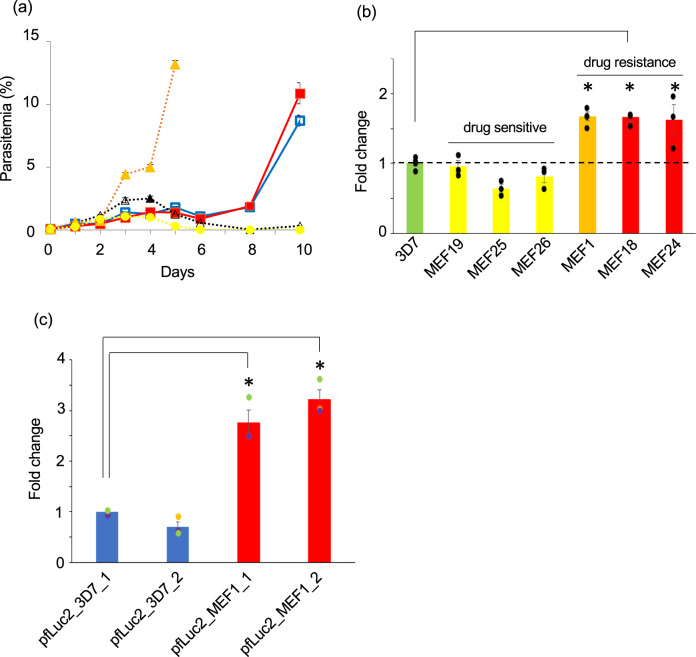
Fig. 4. Mefloquine resistance caused by PfMDR7.
a The mefloquine resistance of a transgenic parasite, into which pfmdr7 of the MEF1 (red) and the 3D7 (blue) were introduced, were examined. In addition, the mefloquine resistance of the 3D7 (black), the MEF1 (orange), and the negative control parasite (yellow) into which only pFCENv1 was introduced were also examined. b The mRNA level of pfmdr7 in the MEF1(orange) was analyzed by RT-qPCR. In addition, those of three mefloquine-sensitive (yellow) and two mefloquine-resistant parasites (red), which were collected from patients living in the Thai–Myanmar border area, were analyzed. Strains 3D7 (green) were used as a negative control. All assays were performed using n = 3 biological independent samples of each parasite strains. Error bars are SEM, and the measure of the center is the means value. The P values were calculated from statistical analysis with a two-sided Student’s t test. Asterisks indicate P values <0.05 for comparisons between the 3D7 and the resistant parasites. c The promoter activities of the pfmdr7 of the MEF1 (red) and the 3D7 (bule) were examined using the transgenic parasites, in which the plasmids having each promoter were introduced. Transfection was performed in duplicates for each plasmid. The relative changes of luminescence of transgenic parasites were estimated based on one transgenic parasite, in which the promoter of pfmdr7 of the 3D7 was introduced. Assays were performed using n = 3 biological independent samples of transgenic parasites. Error bars are SEM, and the measure of the center is the means value. The P values were calculated from statistical analysis with a two-sided Student’s t test. Asterisks indicate P values <0.005 for comparison between the samples. Source data are provided as a Source Data file.

