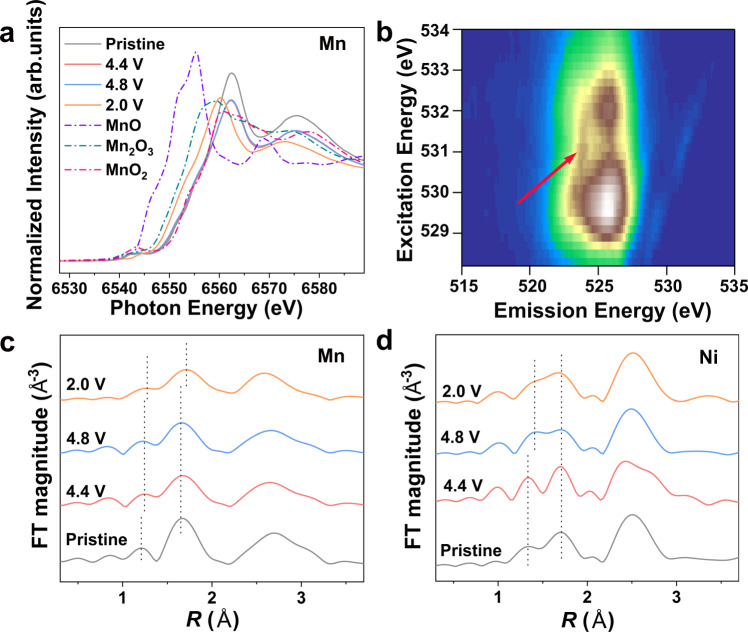
Fig. 6. Ex situ X-ray characterizations of Li1.46Ni0.32Mn1.2O4–x-based electrodes.
a Normalized ex situ Mn K-edge XANES spectra obtained from CD-LNMO electrodes at different voltages during the first cycle. The Mn K-edge XANES spectra of MnO, Mn2O3, and MnO2 are shown for reference. The 4.4 V and 4.8 V curves are charged states, and the 2.0 V curve is the discharge state. The cells are cycled within 2.0–4.8 V at a specific current of 100 mA g−1 under 25 ± 5 °C. b O-K-edge mRIXS mapping of 4.8 V charged electrodes obtained with the specific current of 100 mA g−1. The oxidized oxygen feature is marked by a red arrow. c, d k3-weighted Fourier transform magnitudes of c Mn K-edge EXAFS spectra and d Ni K-edge EXAFS spectra obtained from CD-LNMO electrodes at different voltages during the first cycle. The position of the first two shell coordination peaks (within 1 ~2 Å) is marked by dashed lines.

