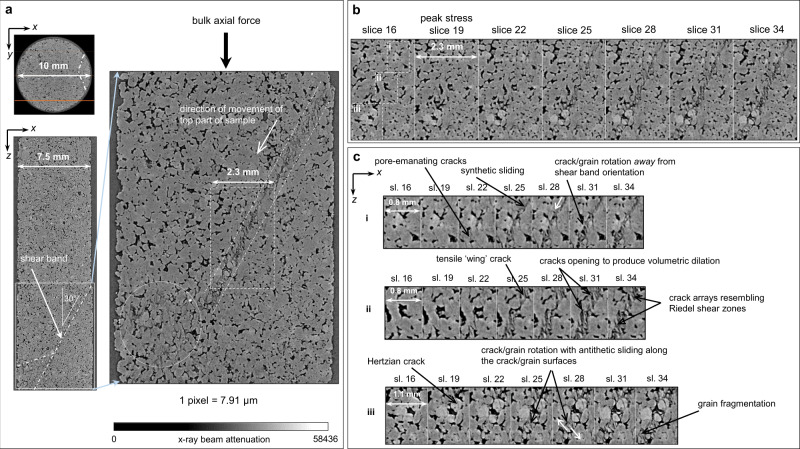
Fig. 2. Microscale damage evolution close to and following peak stress.
a Reconstructed 2D X-ray microtomographic (μCT) slice (x,y-oriented, where x and y are perpendicular to each other and to the direction of loading, and x is across-strike and y is along-strike of the shear zone) showing the plane (orange line) of a re-slice of the original μCT volume (x,z-oriented, where z is the direction of loading) where the shear zone initially localised. The corresponding across-strike (x,z-oriented) re-slice is shown directly below the x,y-oriented slice with the shear zone highlighted by dash-dot lines. Zoomed-in view of the portion of the x,z-oriented re-slice contained within the solid box is shown between the pale blue arrows, highlighting the narrow shear zone that formed after peak stress (between the dash-dot lines), and the region of damage that formed after yield but before peak stress (dotted circle). b Further zoomed-in view of the across-strike slices (x,z-oriented) for selected tomograms, labelled with the number by which they appeared in the time-series (see Fig. 1 for the locations of these scans in the stress-time and stress-strain evolution, and Fig. 3 for the local strain increments following each of these scans) showing shear zone emergence and development in region shown by dashed box in zoomed-in view in a. c Even further zoomed-in slices (x,z-oriented) highlighting the variety of micro-mechanisms involved in shear zone formation: numbers i–iii correspond to the dashed boxes in (b; slice 16). When the whole time-series is viewed as an animation (Supplementary Movies 1 and 2), the micro-mechanisms illustrated by the annotations are apparent. The grey-scale intensity represents the X-ray beam attenuation to the rock. Darker pixels represent structures with less beam attenuation, i.e. lower density structures such as pores or cracks. Lighter pixels represent structures with more beam attenuation, i.e. higher density structures such as mineral grains.

