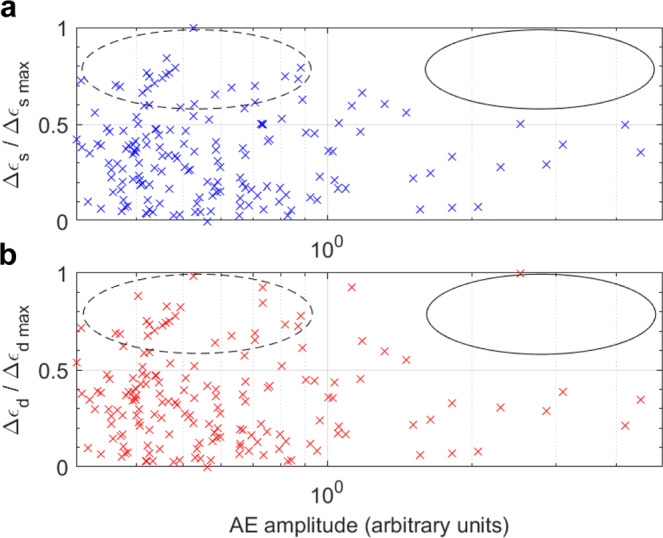
Fig. 5. Relationship between acoustic emission (AE) amplitude (in log-scale) and local incremental strain at the AE location.

a Incremental shear strain, Δϵs (blue crosses), and b incremental dilation, Δϵd (red crosses), each normalised by their respective maximum. The solid black ellipses highlight the lack of large AE events at locations of large strain; indicative of predominantly aseismic deformation. Conversely, the dashed black ellipses highlight locations of large strain which are connected to mostly smaller AE events. Larger AE events are mostly associated with smaller strains.
