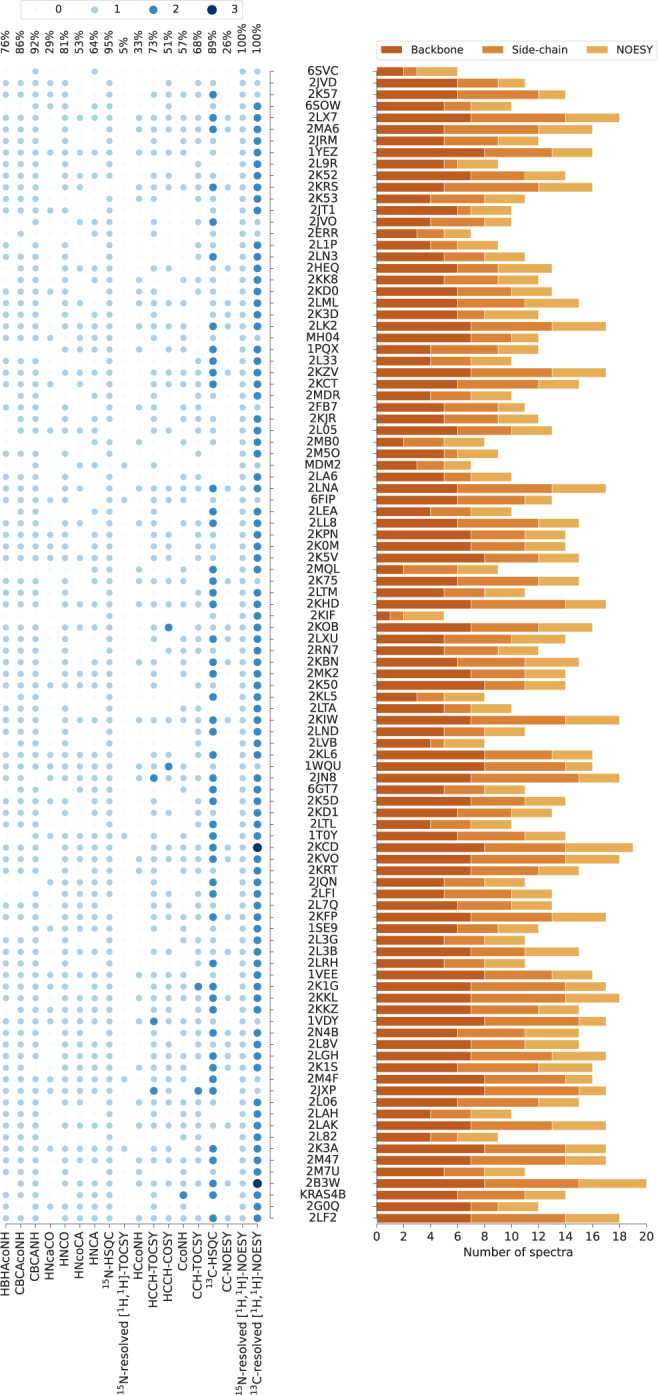
Fig. 2. NMR benchmark dataset content.

PDB codes (or names, MH04, MDM2, KRAS4B, if PDB code unavailable) of the 100 benchmark proteins are ordered by the number of residues. The histogram shows the number of spectra for backbone assignment, side-chain assignment, and NOE measurement. Spectrum types in each data set are shown by light to dark blue circles indicating the number of individual spectra of the given type. The percentages of benchmark records that contain a given spectrum type are given at the top. Spectrum types present in less than 5% of the data sets have been omitted.
