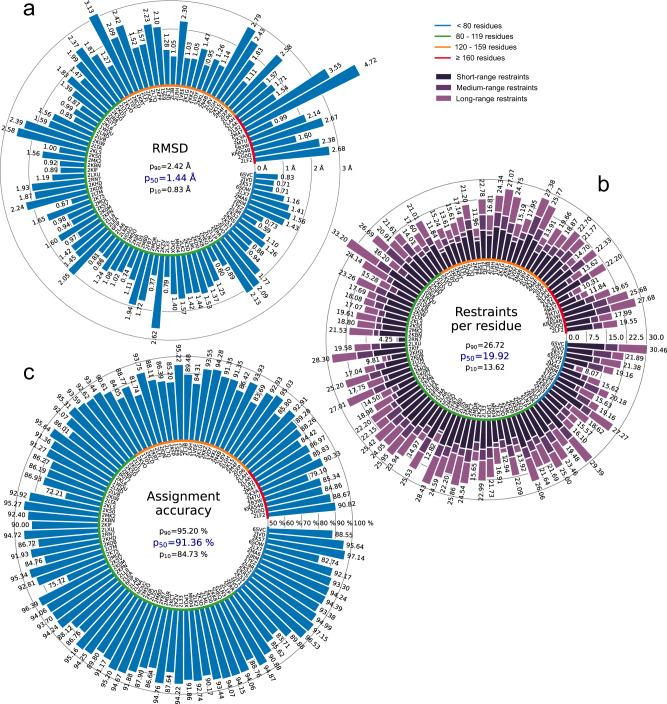
Fig. 4. Results of the automated structure determination of 100 proteins.
a Backbone RMSD to reference. b Number of distance restraints per residue. c Chemical shift assignment accuracy. Bars represent quantity values for benchmark proteins, identified by PDB codes (or protein names). Proteins are ordered by size, which is indicated by a color-coded circle. Values in the center of each panel are 10th, 50th, and 90th percentiles of values presented in the bar plot. Short/medium/long-range restraints are between residues i and j with |i – j| ≤ 1, 2 ≤ |i – j| ≤ 4, and |i – j| ≥ 5, respectively.

