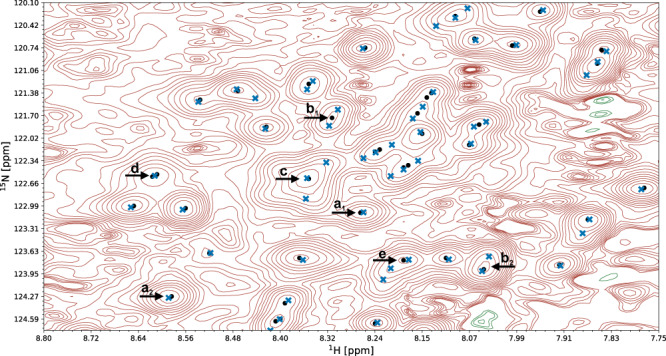
Fig. 6. Commonly occurring challenges in visual spectrum analysis.

A fragment of a 15N-HSQC spectrum of the protein 1T0Y is shown. Initial signal positions identified by the peak picking model pp-ResNet (black dots) are deconvolved by deconv-ResNet, yielding the final coordinates used for automated assignment and structure determination (blue crosses). a1, a2 Initial peak picking marker position is refined by the deconvolution model. b1, b2 pp-ResNet output is deconvolved into two components. c The deconvolution model supports maximally 3 components per initial signal. d Two peak picking markers are merged by the deconvolution model. e Peak picking output deconvolved into three components.
