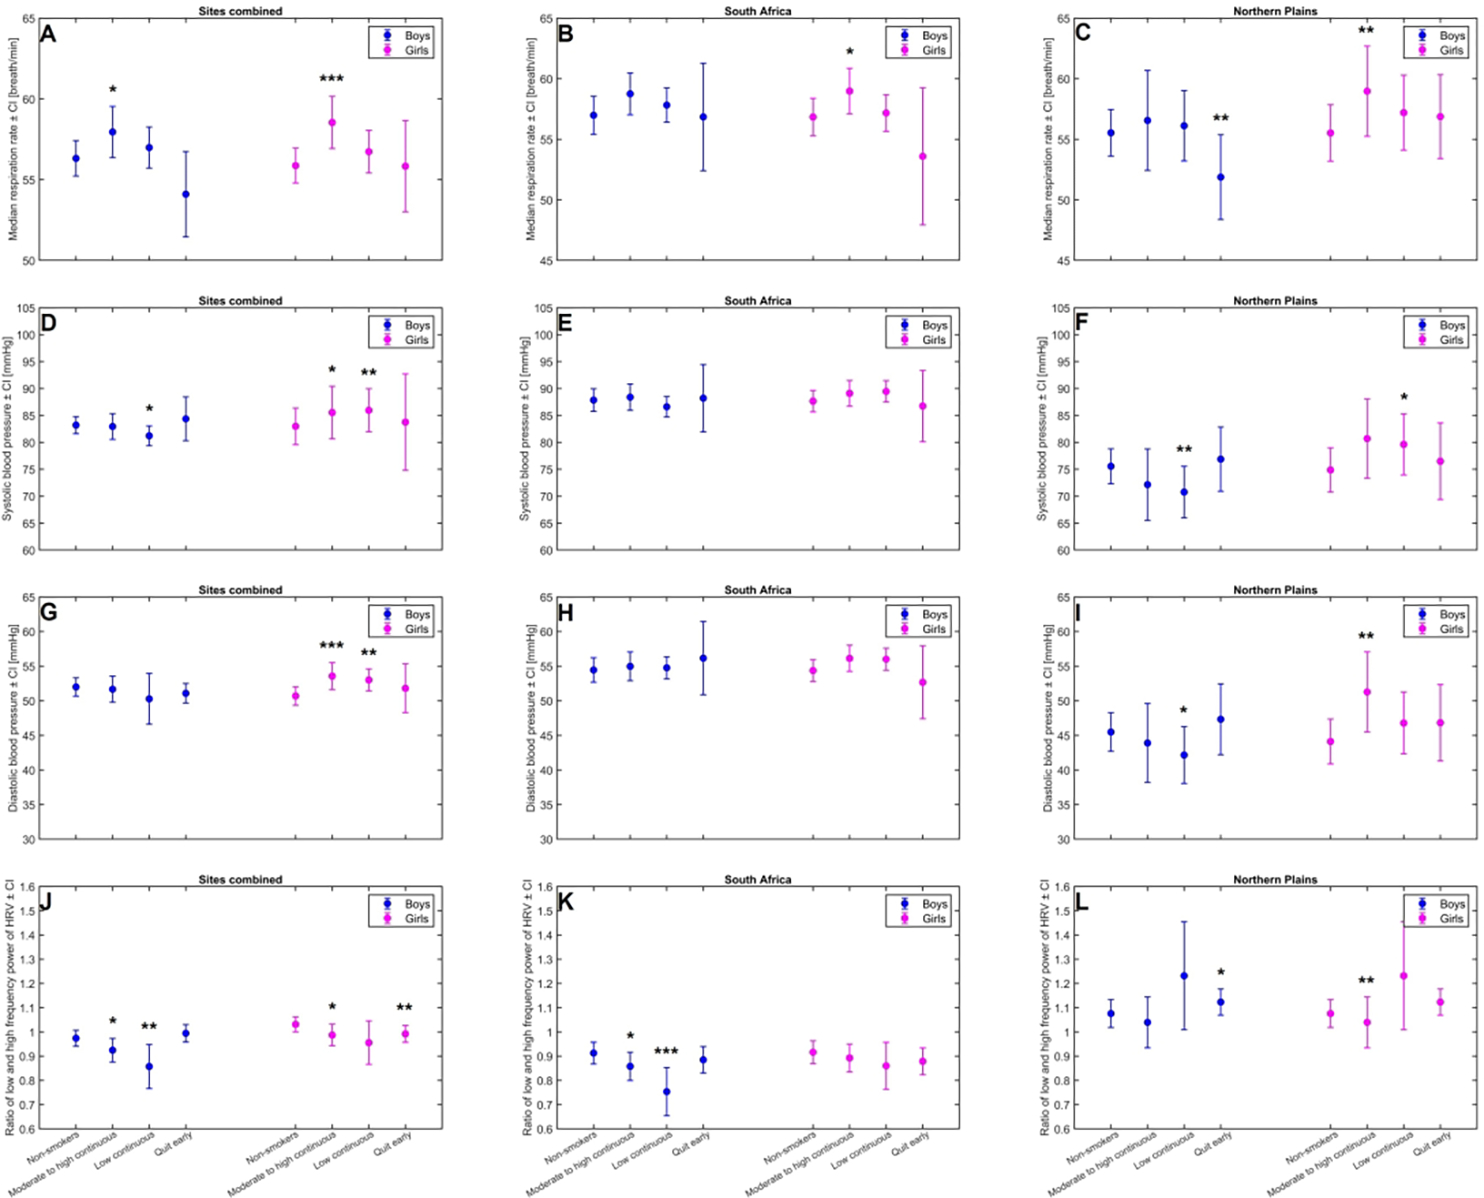
Figure 2: Marginal means in each exposure categories, stratified by study site and infant sex.

Panel A, B and C shows median respiration rate for smoking exposure groups for both sites, South Africa, and Northern Plains, respectively.
Panel D, E, F shows Systolic BP for smoking exposure groups for both sites, South Africa and Northern Plains, respectively.
Panel G, H, I show diastolic BP for smoking exposure groups for both sites, South Africa and Northern Plains, respectively.
Panel J, K, L shows ratio of low-to-high frequency heart rate variability for alcohol exposure groups for both sites, South Africa, and Northern Plains, respectively.
*p<0.1, **p <0.05, ***p <0.01 indicates significance of the difference in marginal mean in comparison to the reference group, non-smoker, or non-drinker
