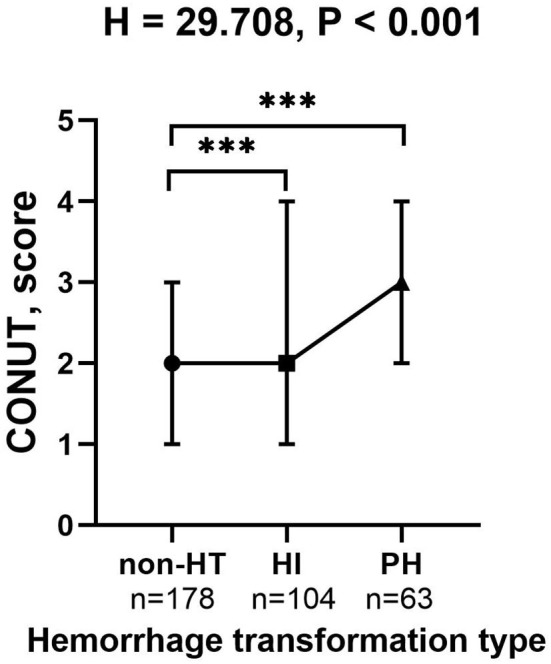
Figure 2.

The CONUT score in the subcategorized groups of HT. Each data point and error bar represent the median and interquartile range of the CONUT score of the subcategorized groups of HT. CONUT, controlling nutritional status score; HT, hemorrhagic transformation; HI, hemorrhagic infarct; and PH, parenchymal hematoma. ***P < 0.001.
