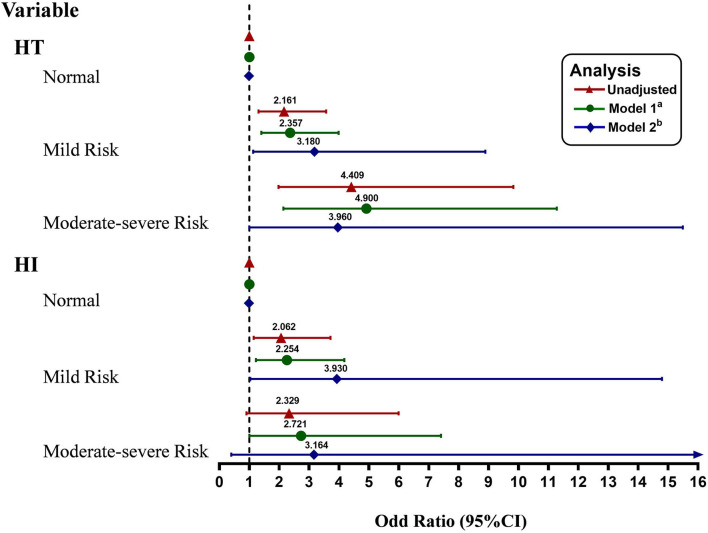
Figure 3.
Multivariate adjusted odds ratios for the association between the different malnutrition risks and the subcategorized groups of HT (including HT and HI, respectively). Reference OR (1.000) is the normal nutritional status group. aModel 1: adjusted for age and sex. bModel 2 was additionally adjusted for hypertension, atrial fibrillation, diabetes, dyslipidemia, history of stroke, smoking status, current alcohol drinking, size of the infarction area, stroke mechanism, SBP, baseline white cell count, fibrinogen, creatinine, baseline NIHSS score, thrombolytic therapy, and anticoagulant and antiplatelet use before admission. CI, confidence level; HT, hemorrhagic transformation; and HI, hemorrhagic infarct.

