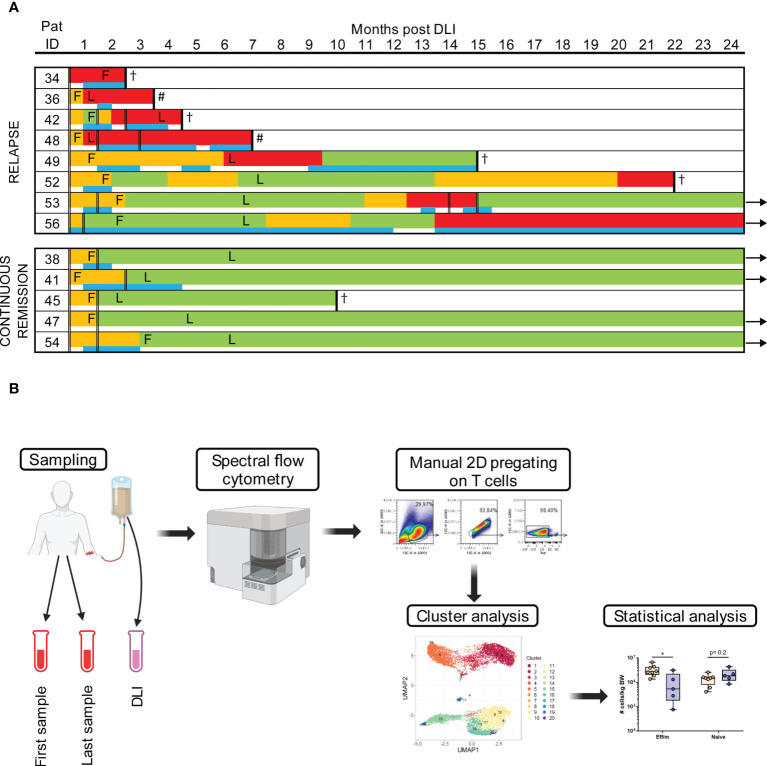
Figure 1.
Study work flow and response to DLI. (A) Every patient is represented by one line with color coding giving details of timing and duration of GVL (green), noGVL (orange) and relapse (red) and the timing of concomitant antineoplastic treatment (blue). Application of DLIs is shown with double lines, timing of the first (F) and last (L) samples post DLI is marked in the time line of each patient. Follow-up time was 24 months. Arrows indicate continued survival beyond the study follow up, # indicates second allogeneic hematopoietic stem cell transplantation, † indicates death. (B) The workflow is shown. After sampling, PBMCs were measured with spectral flow cytometry. Data was then manually pre-gated on T cells for cluster analysis, which were subsequently statistically evaluated. Figure 1B was created with BioRender.com.

