Figure 2.
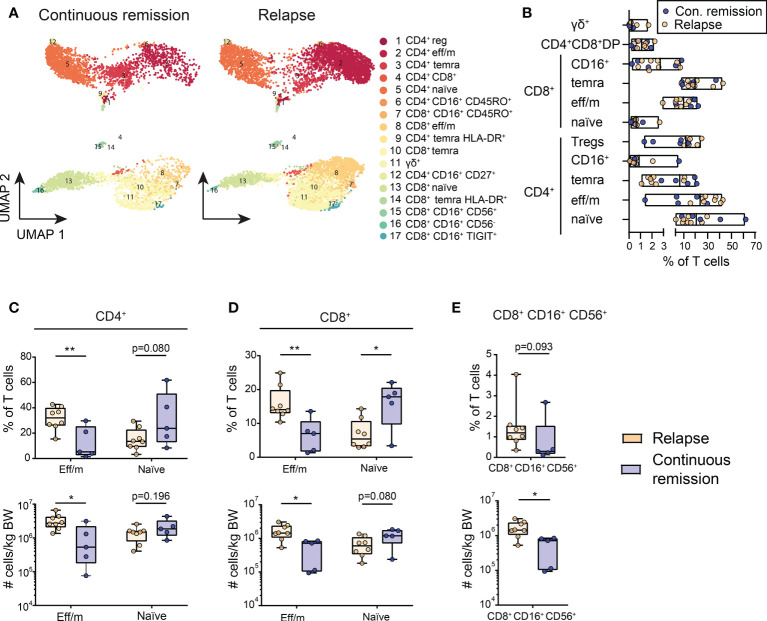
Differentially activated T cell clusters in the DLI cell product are associated with outcome. (A) Cluster analysis identified 17 different T cell populations within the DLI cell product. These are shown in Uniform Manifold Approximation and Projection (UMAP) for patients with continuous remission post DLI (n=5) and for patients with relapse post DLI (n=8) during the 24 months follow-up. The details on the 17 identified clusters are listed in Supplementary Table S4 . (B) Composition of DLI cell products is shown, displaying the frequency of main T cell subsets. Each dot represents one DLI, with color-coding indicating the outcome to the cell product during a 24 months follow-up post DLI (blue = continuous remission, orange = relapse). Lines represent mean and bars represent the minimum and maximum. (C–E) Comparison of frequencies and cell counts of five clusters of the DLI cell product bags, with (C) showing results for CD4+ and (D) for CD8+ effector memory (eff/m) and naïve clusters and (E) CD8+ CD16+ CD56+ cluster. Grouping is based on the DLI cell product recipient’s outcome during a 24 months follow-up with continuous remission (blue, n=5) and relapse (orange, n=8). Clusters are named as in (A). (C–E) Lines represent median, boxes represent 25th and 75th percentile and whiskers represent minimum and maximum. Statistical analysis (C–E) was performed by Student t test or Mann-Whitney test (two-tailed). *p<0.05, **p<0.001.

