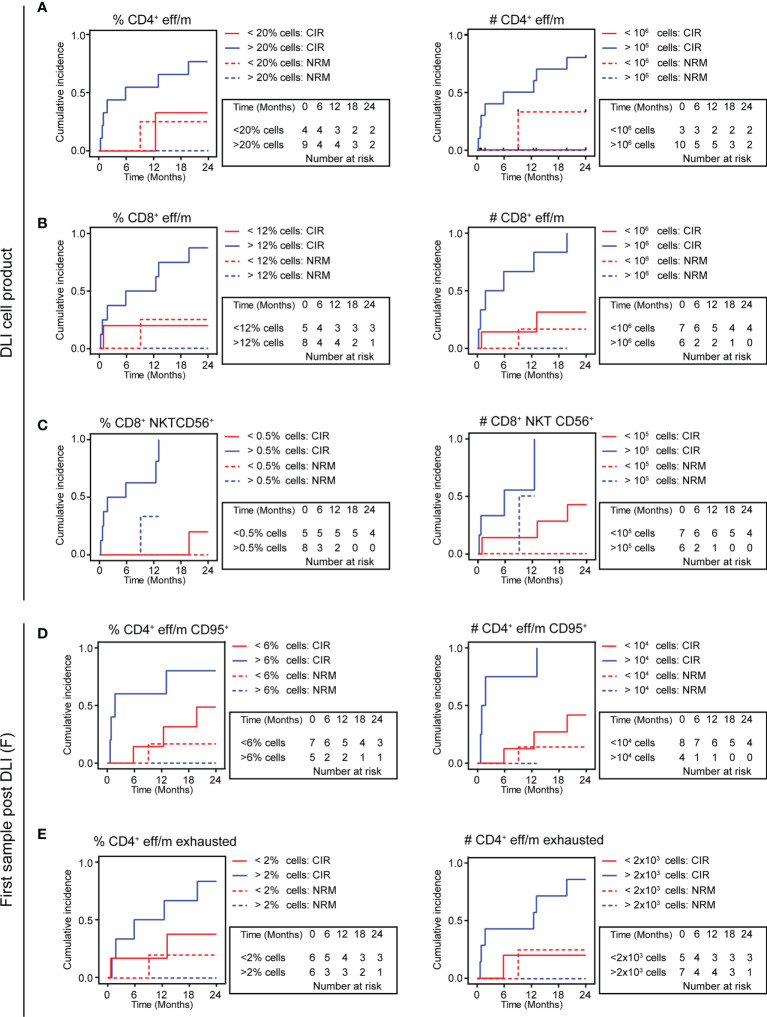
Figure 4.
Relapse incidence is predicted by high vs. low eff/m T cell clusters. (A–E) Cumulative incidence curves (24 months follow-up) are displayed with relapse incidence (CIR, solid lines) and non-relapse mortality (NRM, dotted lines) as competing events for DLI cell products (A–C) or patient samples early after DLI (D, E), discriminating between low (red) and high (blue) frequencies or absolute counts. (A) Shows in the left panel results for DLI cell products’ frequencies of CD4+ eff/m (>20% cells, n=9 vs. <20% cells, n=4, CIR, p=0.098; NRM, p=0.140), and in the right panel DLI cell products’ absolute counts of CD4+ eff/m (>106 cells/ml, n=10 vs. <106 cells/ml, n=3, CIR, p=0.039; NRM, p=0.071). (B) Shows in the left panel results for DLI cell products’ frequencies of CD8+ eff/m (>12% cells, n=6 vs. <12% cells, n=7, CIR, p=0.045; NRM, p=0.217), and in the right panel DLI cell products’ absolute counts of CD8+ eff/m (>106 cells/ml, n=6 vs. <106 cells/ml, n=7, CIR, p=0.009; NRM, p=0.382). (C) Shows in the left panel results for DLI cell products’ frequencies of CD8+ CD16+ CD56+ (>0.5% cells, n=8 vs. <0.5% cells, n=5, CIR, p=0.005; NRM, p=0.443), and in the right panel DLI cell products’ absolute counts of CD8+ CD16+ CD56+ (>105 cells/ml, n=6 vs. <105 cells/ml, n=7, CIR, p=0.023; NRM, p=0.308). (D) Shows in the left panel results for patient samples’ frequencies of CD4+ eff/m (>6% cells, n=5 vs. <6% cells, n=7, CIR, p=0.098; NRM, p=0.422), and in the right panel patient samples’ absolute counts of CD4+ eff/m (>10.000 cells/ml, n=4 vs. <10.000 cells/ml, n=8, CIR, p=0.004; NRM, p=0.536). (E) Shows in the left panel results for patient samples’ frequencies of exhausted CD4+ eff/m (>2% cells, n=6 vs. <2% cells, n=6 CIR, p=0.124; NRM, p=0.332), and in the right panel patient samples’ absolute counts of exhausted CD4+ eff/m (>2.000 cells/ml, n=7 vs. <2.000 cells/ml, n=5, CIR, p=0.046; NRM, p=0.248) and in the right panel. CIR and NRM were investigated by means of cumulative incidence curves employing Gray’s test.

