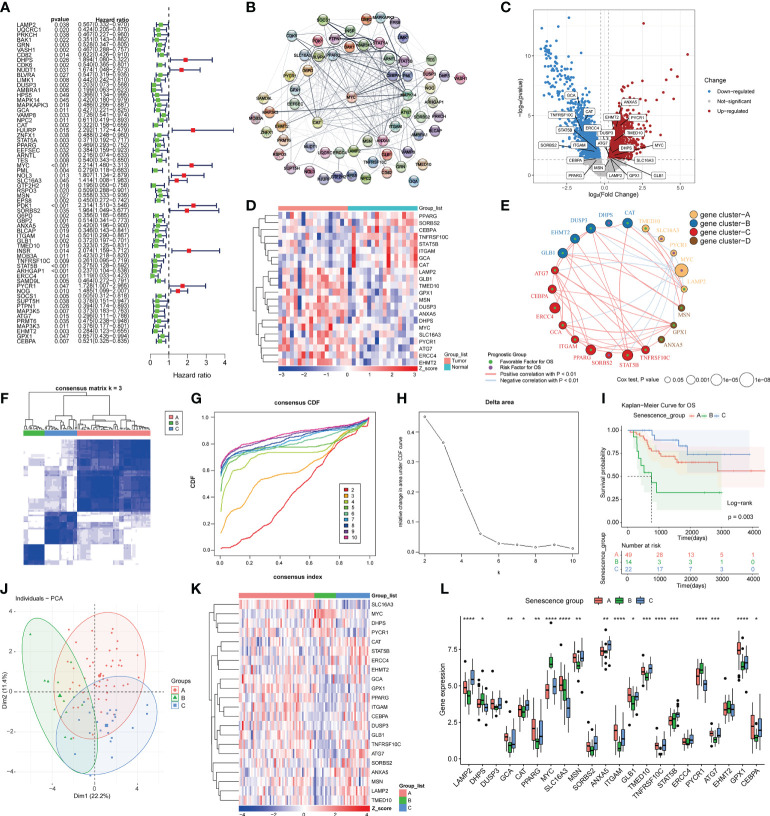
Figure 1.
Prognostic gene screening and consensus clustering. (A)Univariate Cox regression of ASIGs for the screening of prognosis-related genes. (B) Construction of a PPI network of 64 prognosis-related genes using STRING. (C) Differential expression analysis of osteosarcoma samples and adjacent samples in GSE99671 (p-value< 0.05 and log2FC > 0.25). (D) Heatmap of 22 prognosis-related differences in ASIGs in GSE99671. (E) Coexpression network of 22 prognosis-related genes in TARGET-OS (p-value< 0.05 and correlation > 0.3). (F) Heatmap of the consensus matrices for k = 3. (G, H) Consensus cumulative distribution function (CDF) plot for 22 ASIGs in TARGET-OS. (I) Kaplan–Meier curves based on three clusters in the TARGET-OS. (J) Principal component analysis (PCA) of the three subgroups. (K, L) Heatmap and box plot of 22 prognosisrelated ASIGs in the three subgroups (*p< 0.05, **p< 0.01, ***p< 0.001, ****p< 0.0001).

