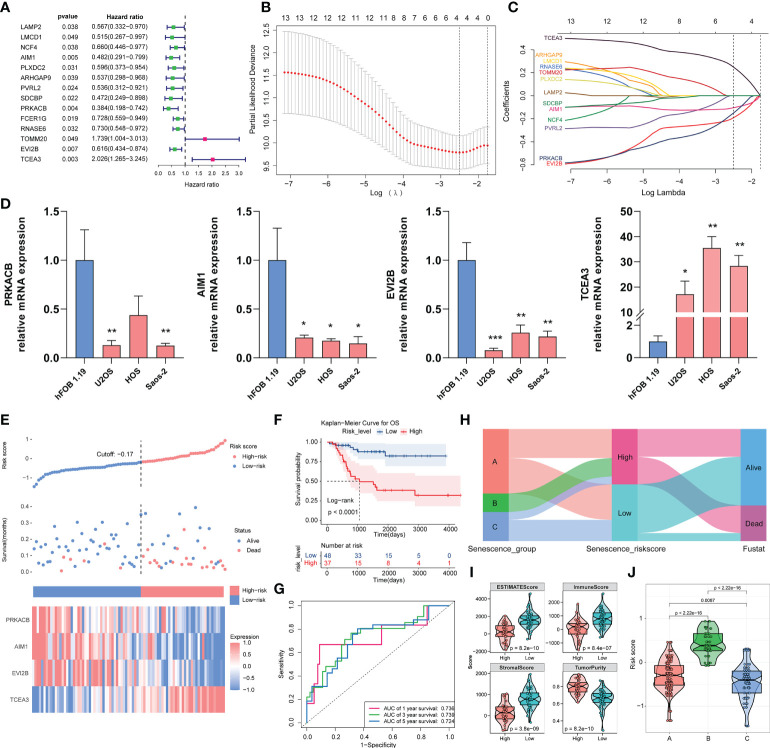
Figure 3.
Construction of the risk model with the TARGET-OS cohort and validation with the validation cohort. (A) Through univariate Cox regression, the prognostic DEGs in the three clusters were screened. (B, C) LASSO regression analysis with optimal lambda. (D) Relative mRNA expression of PRKACB, AIM1, EVI2B and TCEA3 in different cell lines by qPCR. (*p < 0.05, **p < 0.01, ***p < 0.001. Not labeled: no statistical significance compared to hFOB 1.19). (E) Risk scores constructed from candidate genes, patient survival status, and expression heatmaps of the four candidate genes. (F) Survival curve of osteosarcoma patients in different risk groups. (G) ROC curve of the risk score model based on four candidate genes. (H) Relationship of the risk score grouping and survival status of the patients in the three subgroups. (I) ESTIMATE algorithm results for different risk groups. (J) Distribution of risk scores in the three subgroups.

