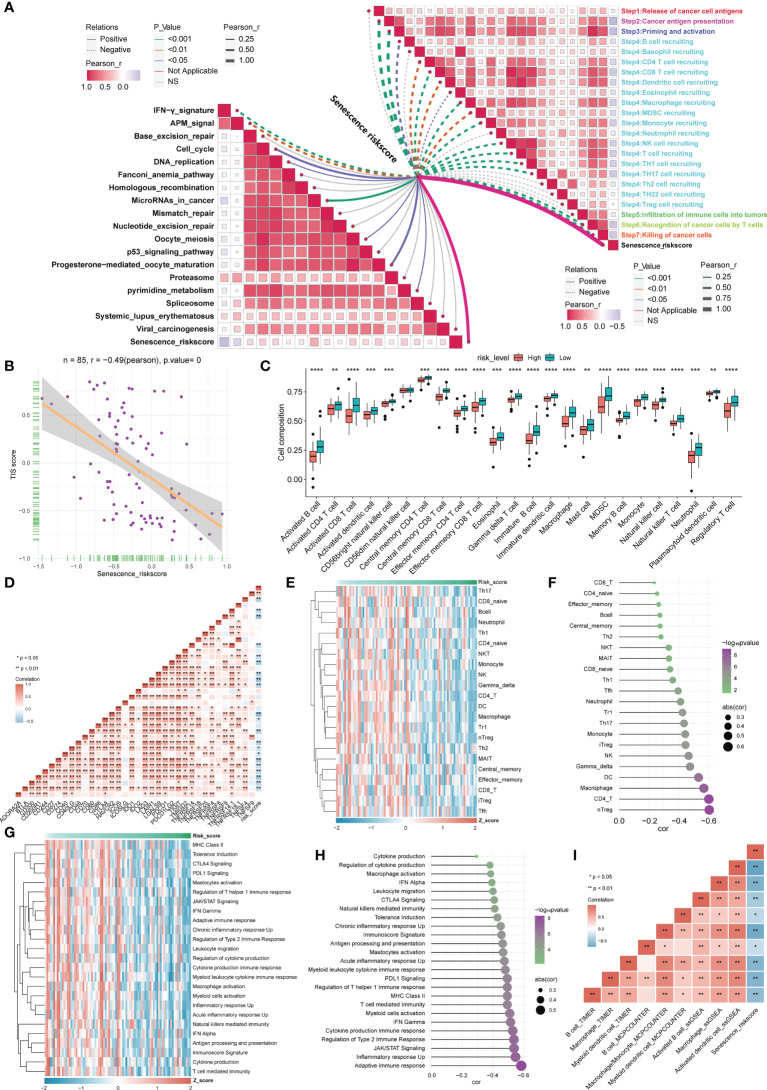
Figure 5.
Correlation analysis between the risk score based on the ASIG subgroup and the TME and ICPs. (A) Correlation between the risk score constructed based on the four candidate genes and the tumor immunity cycle (right) and immunotherapy prediction pathways (left). (B) Correlation between T-cell score and risk score. (C) Distinctions in 28 immune cell infiltration levels between different risk score groups determined using the ssGSEA algorithm (*p< 0.05, **p< 0.01, ***p< 0.001, ****p< 0.0001). (D) Correlation analysis between the risk score constructed based on the four candidate genes and ICP. (E, F) Heatmap and correlation analysis between risk scores constructed based on the four candidate genes and tumor-infiltrating lymphocytes (TILs). (G, H) Heatmap of risk scores and innate immune pathways and correlation analysis. (I) The correlation between APC cell infiltration and risk score was assessed using three algorithms (TIMER, MCPCOUNTER, and ssGSEA).

