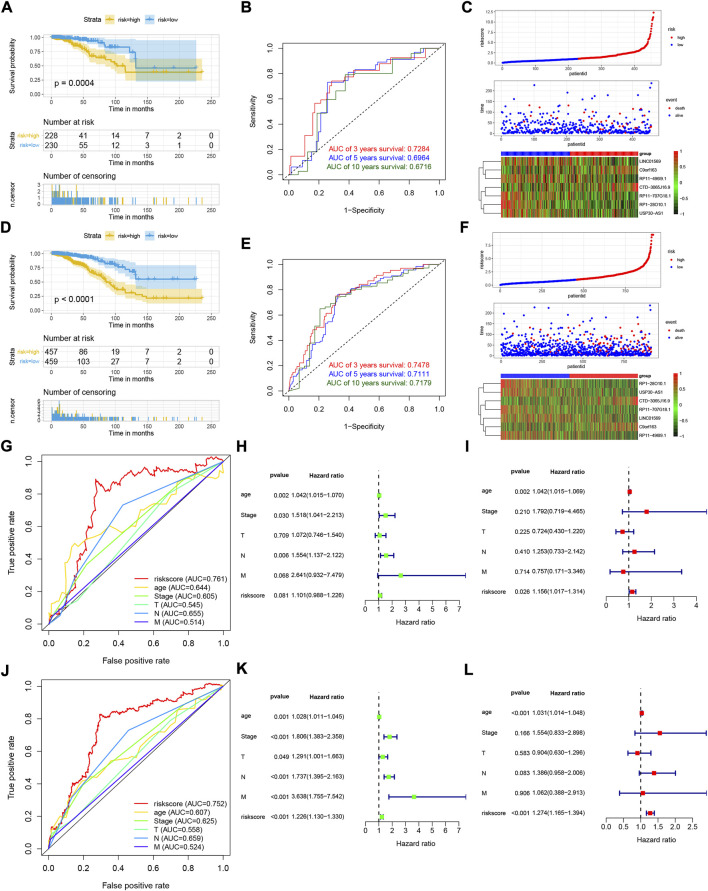
FIGURE 3.
Validation of the LRLPS. The OS curve of the two risk groups in test (A) and entire (D) cohorts. The time-dependent ROC curves in test (B) and entire (E) cohorts. The risk score, clinical event, and the model genes in the two risk groups in test (C) and entire (F) cohorts. The ROC curves of the risk score and other clinicopathological parameters in test (G) and entire (J) cohorts. The univariate Cox regression analyses in the test (H) and entire (K) cohorts. The multivariate Cox regression analyses in the test (I) and entire (L) cohorts.

