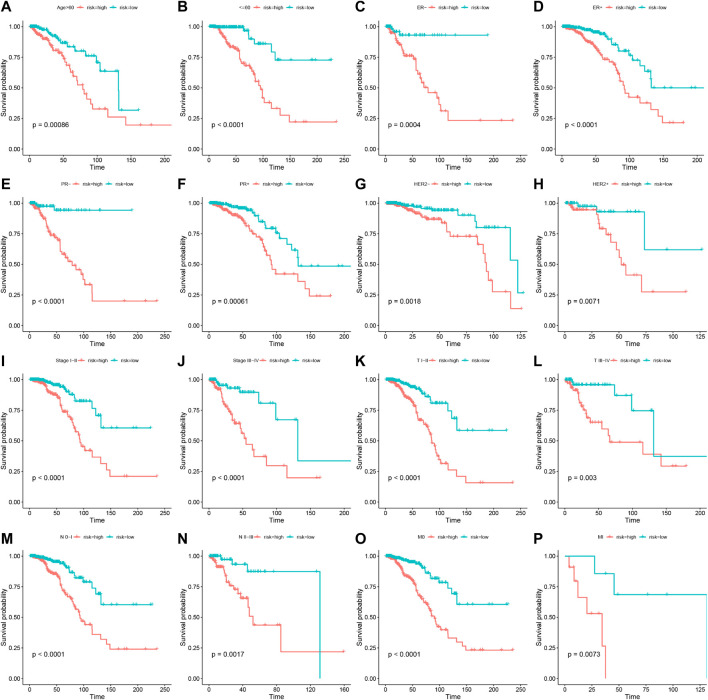
FIGURE 4.
Stratification analyses of the prognostic signature. Kaplan-Meier curves indicated the OS of the two risk groups stratified by age (>60 years vs. ≤60 years) (A,B), ER stage (negative vs. positive) (C,D), HER2 stage (negative vs. positive) (E,F), PR stage (negative vs. positive) (G,H), stages (stage I–II vs. stage III-IV) (I,J), AJCC T stage (T I–II vs. T III-IV) (K,L), AJCC N stage (N 0-I vs. T II-III) (M,N), AJCC M stage (M 0 vs. M I) (O,P), respectively.

