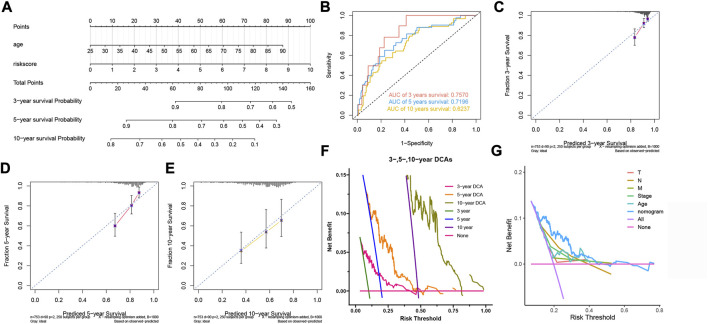
FIGURE 5.
Construction and evaluation of the nomogram. (A) The nomogram for predicting BC patients’ survival probability. (B) The nomogram’s 3-, 5-, and 10-year ROC curves. (C,D,E) The 3-, 5-, and 10-year calibration curves. (F) The 3-, 5- and 10-year DCA curves of the nomogram. (G) DCA curves of clinicopathological factors and the nomogram.

