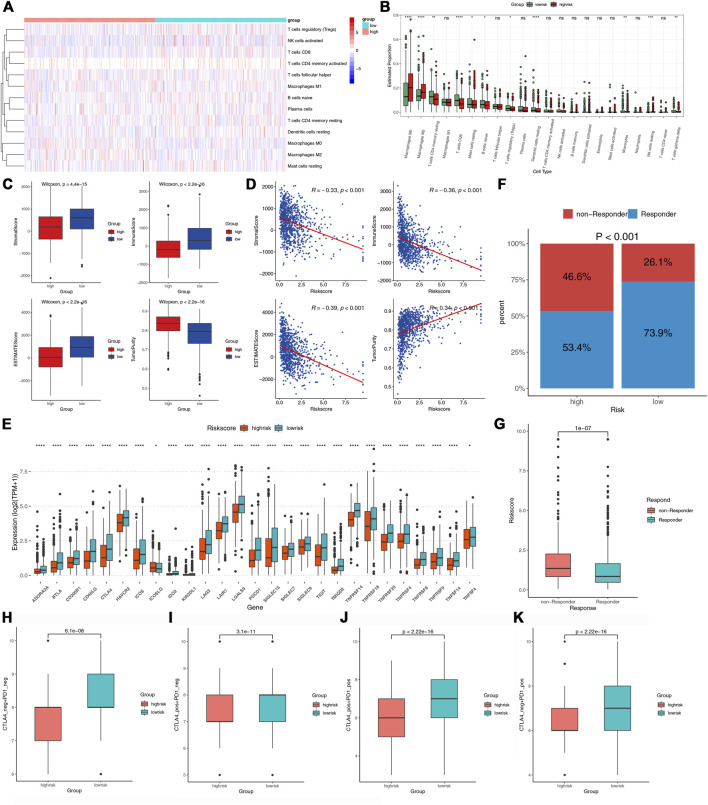
FIGURE 7.
The immune infiltration and immunotherapy response in the two groups. (A,B) The heatmap and box plots of the proportions of tumor-infiltrating cells in the two risk groups. (C) Comparisons of tumor purity stromal, immune, and ESTIMATE scores between the two risk groups. (D) Correlations between the risk score and tumor purity, stromal, immune, and estimate score. (E) Comparisons of the 27 ICPs in the two risk groups. (F) Comparisons of the proportions of non-responders and responders to ICIs between the two risk groups. (G) Comparison of the risk score between the responders and non-responders. (H–K) Comparison of the IPS between the two risk groups.

