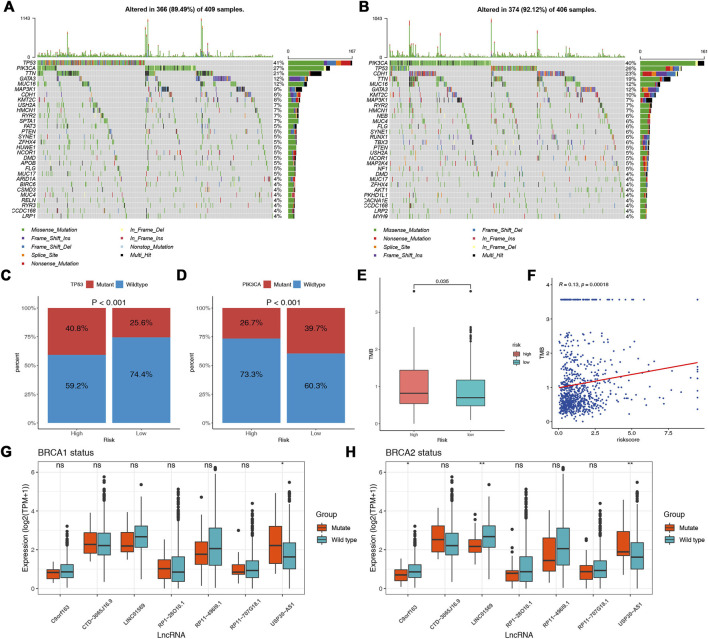
FIGURE 8.
Association between DNA mutation and prognostic model. Waterfall plots of the top 30 mutated genes in the high-risk (A) and low-risk (B) groups. Comparisons of the mutation status of TP53 (C) and PIK3CA (D) in different risk groups. (E) Comparisons of the TMB between the two risk groups. (F) Correlation between TMB and the risk score. (G) Comparisons of the expression of the lncRNAs in different BRCA1 mutation statuses. (H) Comparisons of the expression of the lncRNAs in different BRCA2 mutation statuses.

