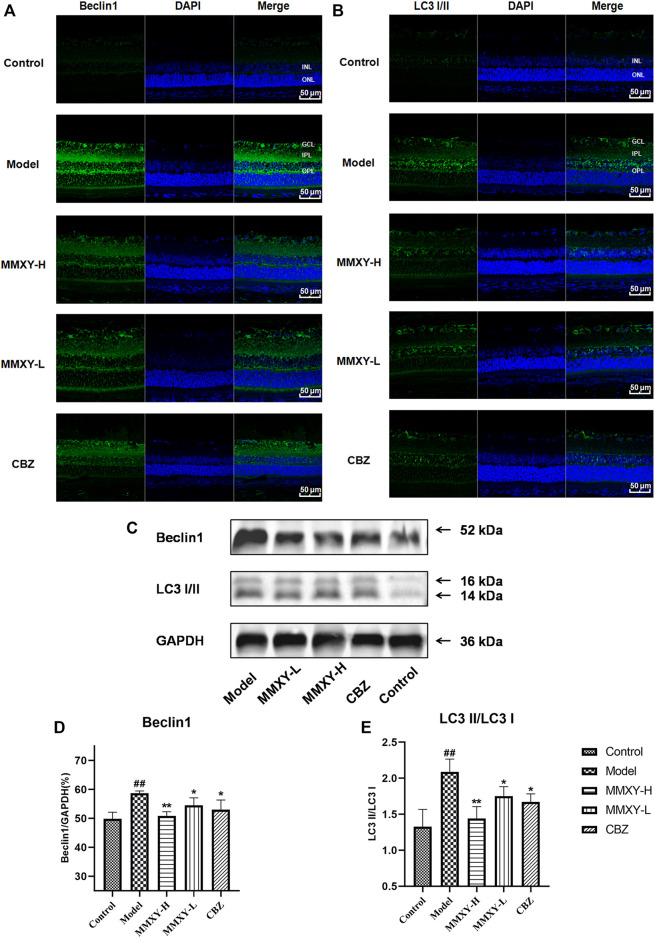
FIGURE 10.
Effects of MMXY on retinal autophagy flux in CUMS rats (A,B) Immunofluorescence staining of Beclin1 (green), LC3 (green) and DAPI (blue) of retinas in each group. Scale bars = 50 µm. (C)Representative images of Western blot showing Beclin1 and LC3I/II expression in the retina of each group. GAPDH was used to confirm an equal amount of protein (n = 3). (D,E) Quantitative expression of Beclin1 and LC3II/LC3I in each group. Results are shown as the mean ± SD (n = 3). # p < 0.05 and ## p < 0.01 vs. control group; *p < 0.05 and **p < 0.01 vs. model group.

