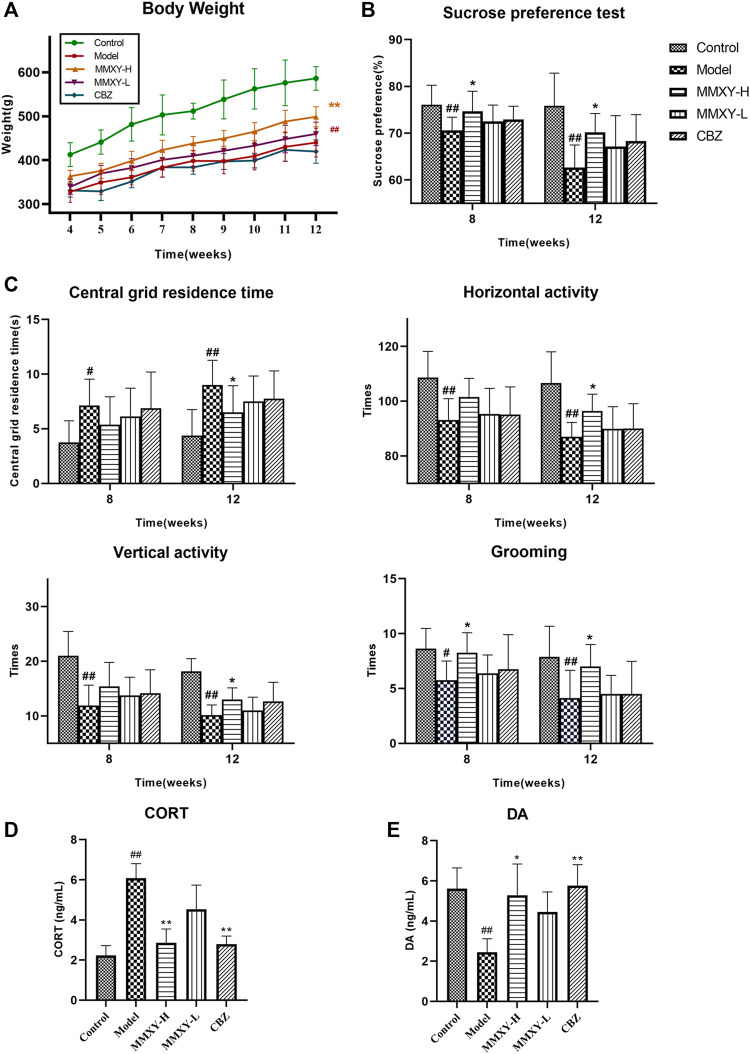
FIGURE 4.
At 4–12 weeks, effects of MMXY on body weight, SPT, OFT, CORT and DA of CUMS rats in control group, model group, MMXY-H group, MMXY-L and CBZ groups. (A) Weight of rats at 4-12 weeks (n = 8). (B) SPT results at weeks 8 and 12 (n = 8). (C) OFT results at weeks 8 and 12, including the central grid residence time, horizontal activity, vertical activity and grooming times (n = 8). Results are shown as the mean ± SD. # p < 0.05 and ## p < 0.01 vs. control group; *p < 0.05 and **p < 0.01 vs. model group. (D,E) At 12 weeks, the level of CORT and DA in each group (n = 8). Results are shown as the median (P25, P75). # p < 0.05 and ## p < 0.01 vs. control group; *p < 0.05 and **p < 0.01 vs. model group.

