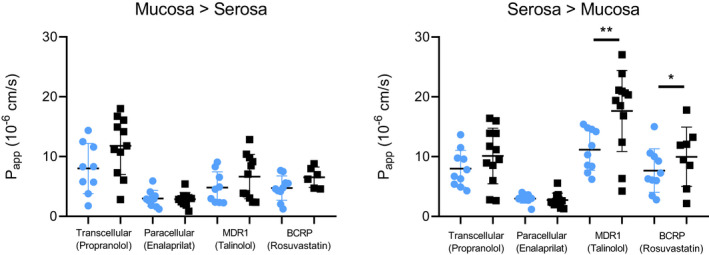
FIGURE 3.

Mean P app values per patient for each drug in both age groups. Mean value per age group ± SD are shown. Blue circles represent the pediatric age group (0–18 years old), black squares represent the adult age group. Statistics performed following mixed models based on estimated marginal means. *p = 0.0091, **p = 0.0005. P app, apparent permeability coefficient.
