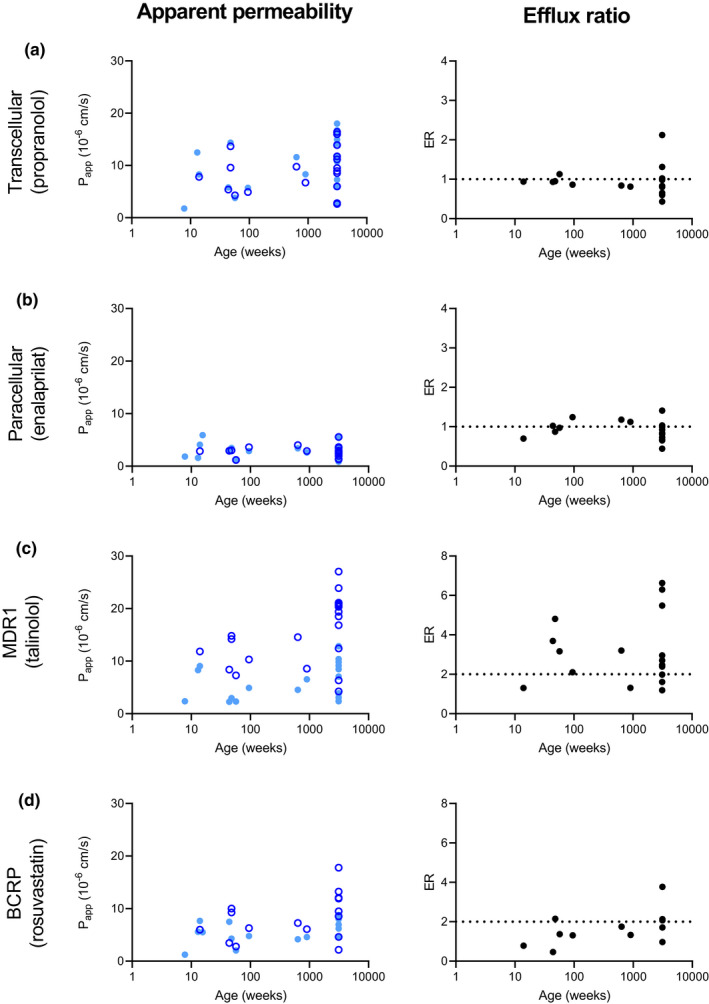
FIGURE 4.

Apparent permeability coefficient (P app) and efflux ratio (ER) values versus age for probe compounds determined in this study. Each point represents a mean value per patient. Light blue closed circles: mucosal to serosal transport of the substrate. Dark blue open circles: serosal to mucosal transport of the substrate. Black circles: mean ER per patient. (a) transcellular transport determined with substrate propranolol. (b) Paracellular transport determined with substrate enalaprilat. (c) Transport by MDR1 determined with substrate talinolol. Spearman correlation showed a correlation for MDR1 with age Rs value of 0.49 (p = 0.0283). (d) Transport by BCRP determined with substrate rosuvastatin. No correlation between ER of talinolol and rosuvastatin was found, Rs value of 0.57 (p > 0.05).
